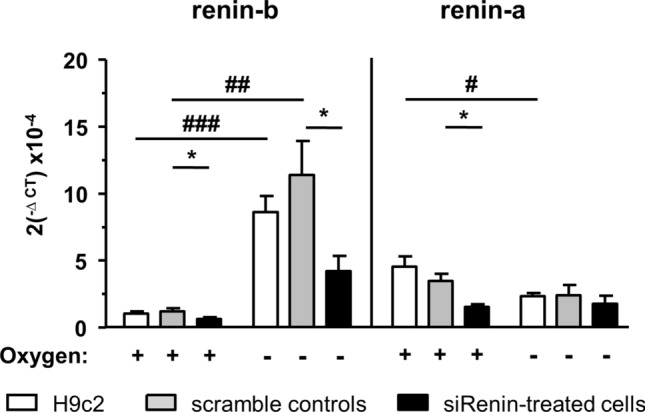
Figure 1.

Renin mRNA abundance after anoxia and effect of renin siRNA. Renin-b and renin-a mRNA expression in H9c2 cells exposed to small interference RNA (siRNA) treatment under control and anoxic conditions (n = 6 independent experiments per group). All data represent mean ± SEM. Data are analyzed by Two-way ANOVA comparing the efficiency of renin downregulation as well as the effect of anoxia as indicated. *P < 0.05 versus scramble siRNA control as real control. #P < 0.05 versus normoxia.
