Figure 2.
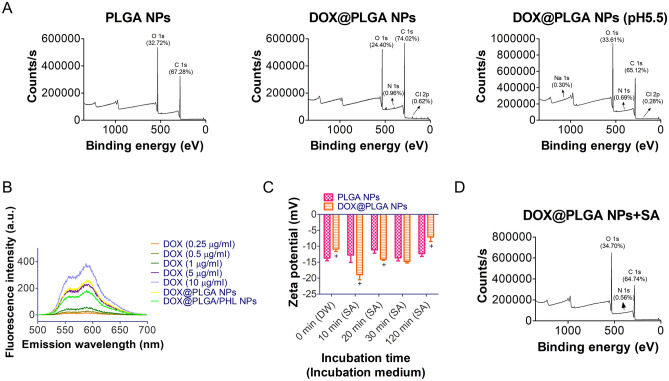
Identification of DOX coating onto PLGA NPs and their interactions with SA. (A) XPS data of PLGA NPs, DOX@PLGA NPs, and DOX@PLGA NPs (after incubation at pH 5.5). Binding energy-dependent counts/s values are shown. Atomic contents are presented in the graph. (B) Fluorescence intensity profiles of DOX (0.25‒10 μg/ml), DOX@PLGA NPs, and DOX@PLGA/PHL NPs. Emission spectra (500‒700 nm) of all samples at 480 nm excitation wavelength are shown. (C) Incubation time-dependent zeta potential values of PLGA NPs and DOX@PLGA NPs after mixing with SA. Zeta potential (mV) values at each determined time (0, 10, 20, 30, and 120 min) are shown. Each point indicates the mean ± SD (n = 3). +p < 0.05, compared with PLGA NPs group. (D) XPS data of DOX@PLGA NPs after incubating with SA. Atomic contents are present in the graph.

