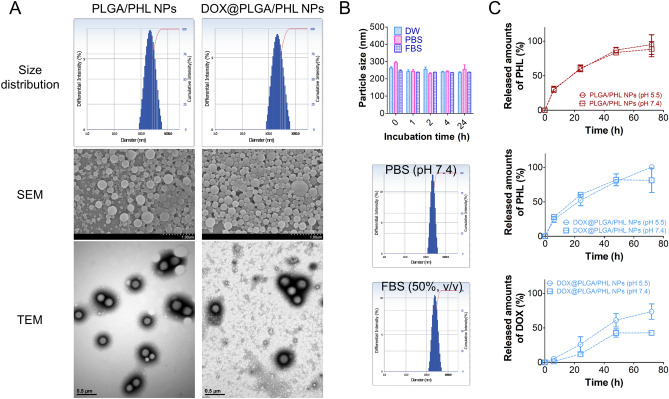
Figure 3.
Particle properties of developed NPs. (A) Size distribution profiles, SEM images, and TEM images of PLGA/PHL NPs and DOX@PLGA/PHL NPs. Diameter-dependent differential intensity (%) profiles are shown as size distribution diagrams. (B) Incubation time-dependent particle size values of DOX@PLGA/PHL NPs in different media (DW, PBS (pH 7.4), and FBS (50%, v/v)). Each point indicates the mean ± SD (n = 3). Particle size distribution profiles, shown as diameter-dependent differential intensity values, of DOX@PLGA/PHL NPs in PBS (pH 7.4) and FBS (50%, v/v) mixture are shown. (C) Release profiles of PHL and DOX from PLGA/PHL NPs and DOX@PLGA/PHL NPs at pH 7.4 and 5.5. Each point indicates the mean ± SD (n = 3).

