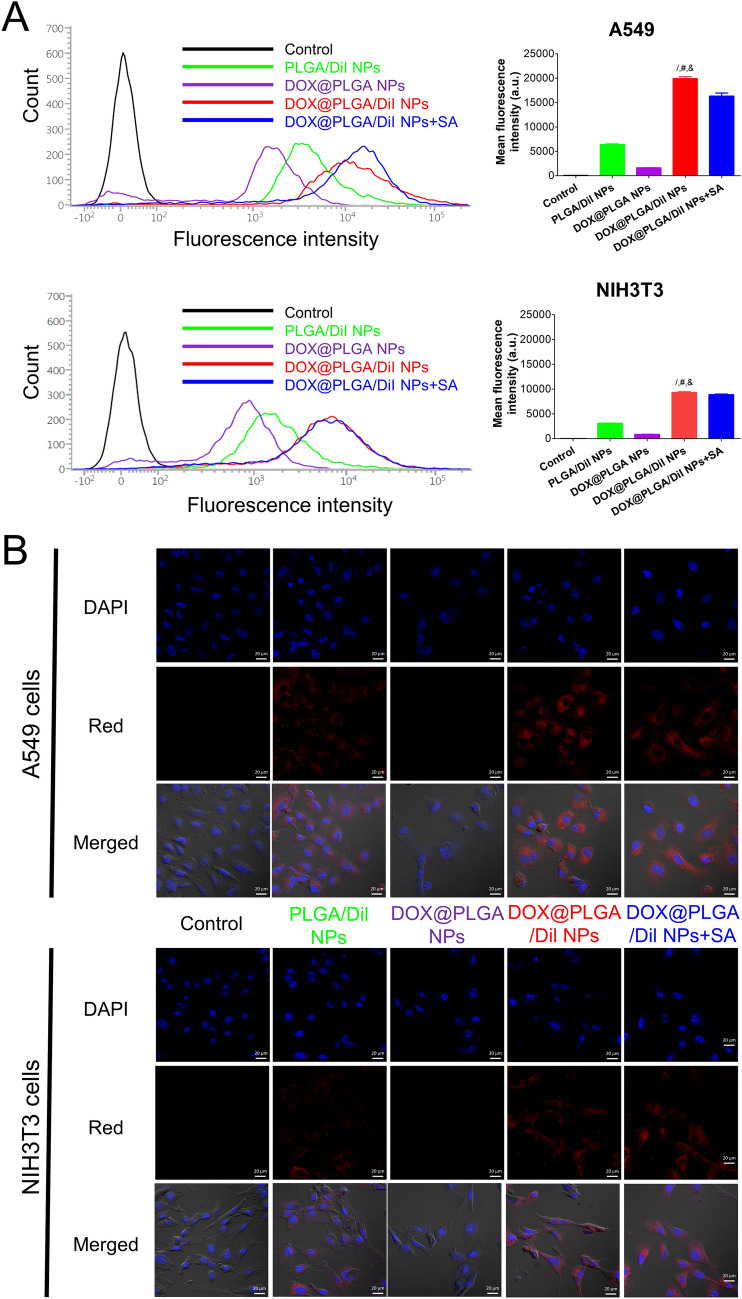
Figure 4.
Cellular accumulation and distribution patterns of developed NPs in A549 and NIH3T3 cells. (A) Cellular uptake data of Dil-loaded NPs in A549 and NIH3T3 cells analyzed by flow cytometry. Cell count values according to the fluorescence intensity of control, PLGA/Dil NPs, DOX@PLGA NPs, DOX@PLGA/Dil NPs, and DOX@PLGA/Dil NPs + SA groups are shown. Mean fluorescence intensity values of all experimental groups are plotted. Each point indicates the mean ± SD (n = 3). /p < 0.05, compared with PLGA/Dil NPs group. #p < 0.05, compared with DOX@PLGA NPs group. &p < 0.05, compared with DOX@PLGA/Dil + SA NPs group. (B) Intracellular fluorescence signals of developed NPs in A549 and NIH3T3 cells observed by CLSM imaging. DAPI, red, and merged images of control, PLGA/Dil NPs, DOX@PLGA NPs, DOX@PLGA/Dil NPs, and DOX@PLGA/Dil NPs + SA groups are shown. The length of scale bar in the image is 20 μm.

