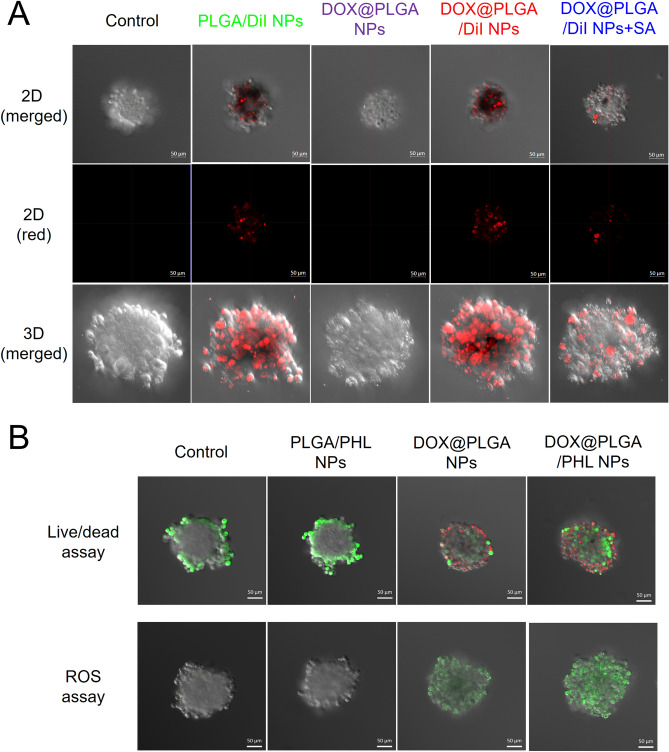
Figure 6.
Tumor penetration capability and anticancer activity tests of developed NPs in A549 multicell spheroid model. (A) Tumor infiltration efficacy test of Dil-loaded NPs in A549 spheroid model. 2D (merged), 2D (red), and 3D (merged) images of control, PLGA/Dil NP, DOX@PLGA NPs, DOX@PLGA/Dil NPs, and DOX@PLGA/Dil NPs + SA groups are shown. The length of scale bar in the image is 50 μm. (B) Spheroid images after applying live/dead assay and ROS assay reagents observed by CLSM imaging. Merged images of control, PLGA/PHL NPs, DOX@PLGA NPs, and DOX@PLGA/PHL NPs are shown. The length of scale bar in the image is 50 μm.

