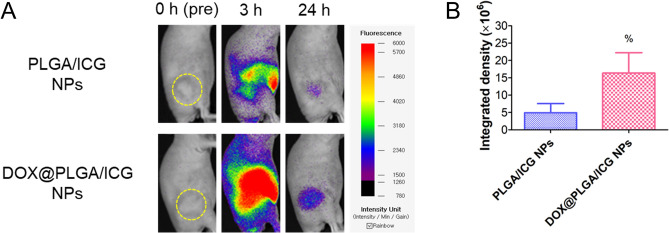
Figure 8.
In vivo tumor targeting efficiency of designed NPs. (A) Whole body scanned NIRF image of PLGA/ICG NPs and DOX@PLGA/ICG NPs. Yellow dotted circle indicates the tumor region in A549 tumor-bearing mouse model. NIRF images at 0 h (pre-injection), 3 h (post-injection), and 24 h (post-injection) are shown. (B) Integrated density of NIRF signals in PLGA/ICG NPs and DOX@PLGA/ICG NPs groups. Each point indicates the mean ± SD (n = 3–6). %p < 0.05, compared with PLGA/ICG NPs group.

