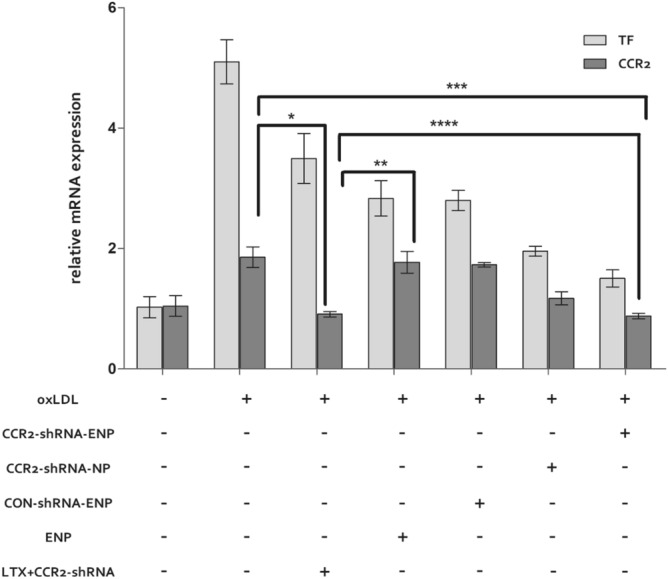
Figure 4.

CCR2 and TF mRNA expression in different transfection agent treated cells. The TF and CCR2 mRNA expression were determined by Q-PCR. The experiments were performed in triplicate (mean ± SD). The mRNA levels from the different nanocarrier treated cells were normalized to the GAPDH mRNA level. The relative fold of the TF and CCR2 mRNA levels from the nanocarrier treated Raw 264.7 was normalized to the negative control from the normal cells. *P < 0.05, **P < 0.05, ***P < 0.05, ****P > 0.05.
