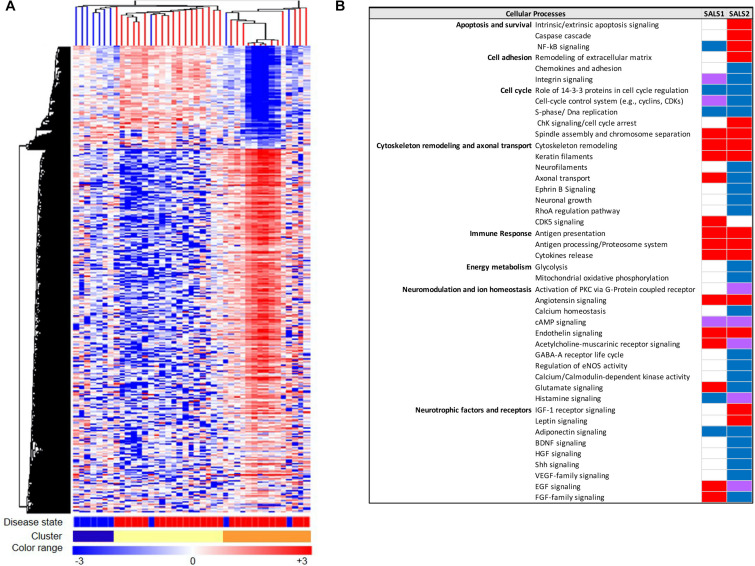
FIGURE 2.
Molecular-based classification of SALS. (A) Unsupervised hierarchical clustering (similarity measure: Pearson centered; linkage rule: average) was used to cluster control (10 fresh-frozen motor cortex samples from non-neurological patients) and SALS patients (31 fresh-frozen motor cortex samples) on the basis of the similarity in expression profiles of the most “hypervariable genes” (9.646 genes with a standard deviation >1.5). The same clustering method clearly distinguished two SALS subgroups (SALS1 and SALS2), each associated to differentially expressed genes and pathways. In this two-dimensional presentation, each row represents a single gene and each column a motor cortex from control or SALS patients. As shown in the color bar, highly expressed genes are shown in orange, down-regulated genes in blue, no change in white. In the dendrograms shown (left and top), the length and the subdivision of the branches display the relatedness of the expression of the probes and the motor cortex (top). The disease state is marked as follows: controls patients are indicated by brown rectangles and SALS patients by red rectangles. In the cluster panel, red rectangle refers to control patients, brown to SALS1 and blue to SALS2 patients. For further details, the reader is referred to Aronica et al. (2015). (B) Functional pathways deregulated in clustered SALS patients. Orange boxes represent signaling pathways significantly up-regulated, blue bars down-regulated, green bars both up- and down-regulated, white bars indicate no significant change. Figure adapted from Morello and Cavallaro (2015).

