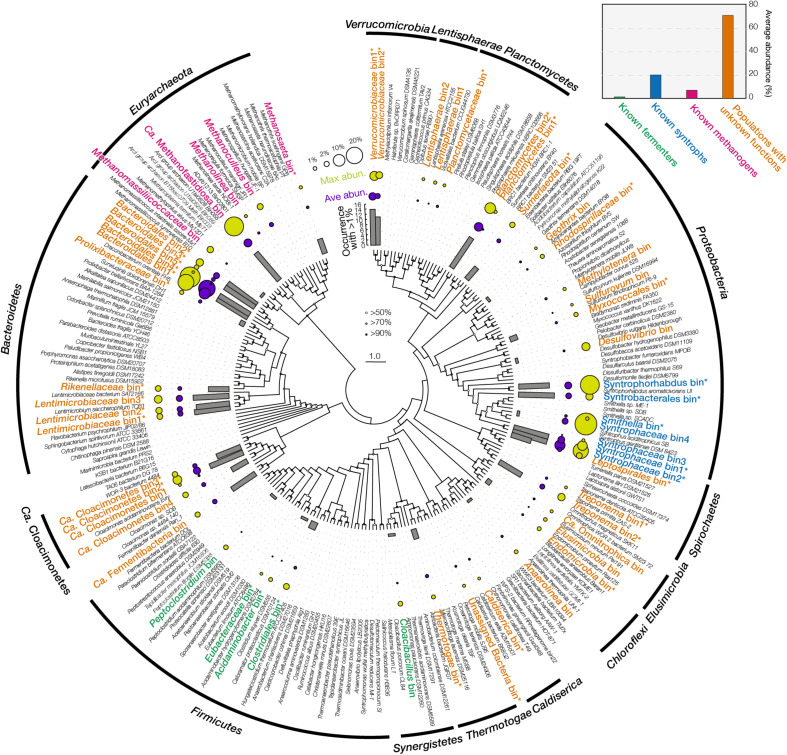
FIGURE 1.
Fifty-six final bins assembled from metagenome. The phylogenetic tree was built using maximum likelihood method with 100 bootstraps. Bootstrap values are denoted using bubbles on the node. Bars in the inner circle denote the occurrence of each bin with an abundance >1% among the 14 metagenomic datasets. Bubbles in the middle circle denote the average metagenomic abundance. Bubbles in the outer circle denote the maximum metagenomic abundance. Bins’ name is colored according to their potential functions. Asterisk after the bins’ name indicates this final bin was merged from multiple bins from different samples clustered together in this tree. Small panel at the top-right corner shows the average abundance of four functional groups.

