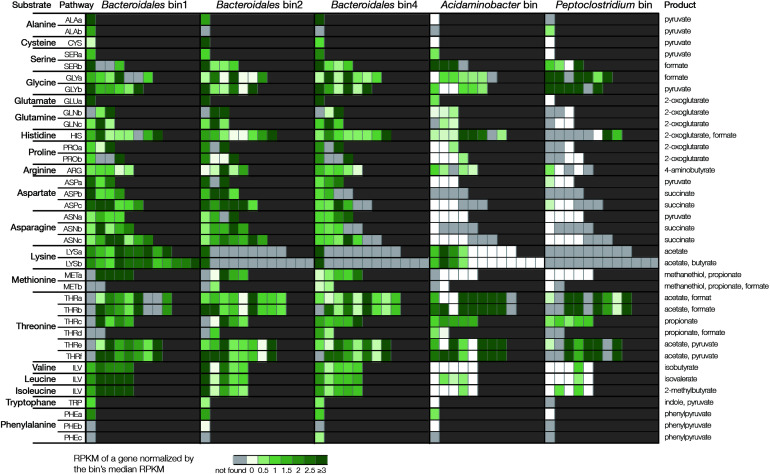
FIGURE 4.
Gene expression of amino acids degradation pathways in the respective cultures. Each substrate can have multiple pathways (details of the pathways are listed in Supplementary Table 5). Genes in each pathway are represented by individual cells. Light gray color indicates the gene is not found in the bins. Color scale from white to green indicates the level of expression based on normalized RPKM value.

