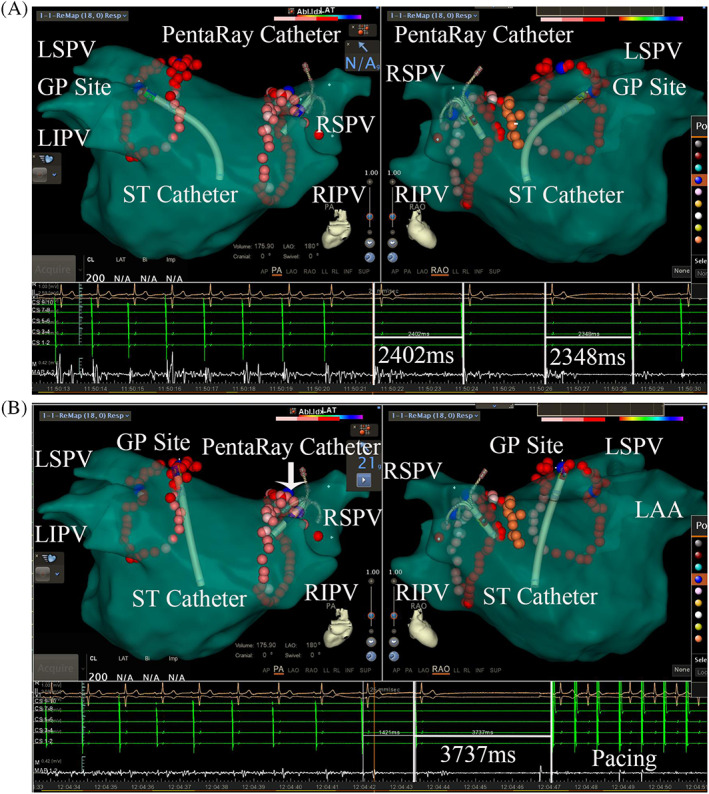
FIGURE 1.

A and B shows a VR induced by delivery of RF energy during PVI in a 65‐year‐old patient. A geometric representation of the left atrium was constructed using the Carto 3 mapping system. The blue spheres represent a notable positive VR at each GP site. A, Shows a VR located between the anterior ridge and the LSPV. B, Shows a VR located in the superolateral area around the root of the LSPV. The red dots represent the ablation points on the LA geometric image. LAA, left auricular appendage; LIPV, left inferior pulmonary vein; LSGP, left superior ganglionated plexus; LSPV, left superior pulmonary vein; RIPV, right inferior pulmonary vein; RSPV, right superior pulmonary vein
