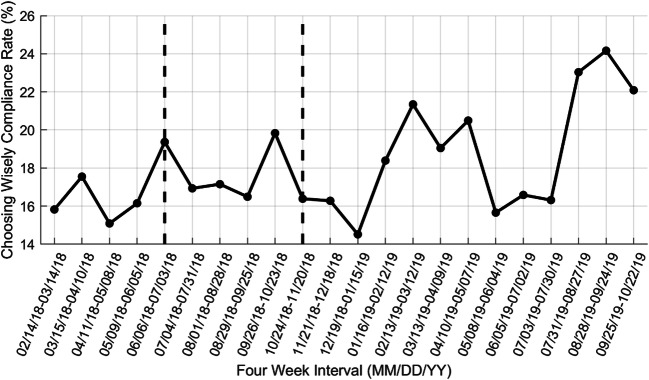
Figure 2.
CW compliance rates in 4-week discrete intervals across all five practice locations. Data to the left of the first vertical dashed bar indicate baseline CW compliance rates prior to initial launch in only the Vanguard practices. Data to the right of the second vertical bar indicate CW compliance rates after activation of the nudges at all five practices.

