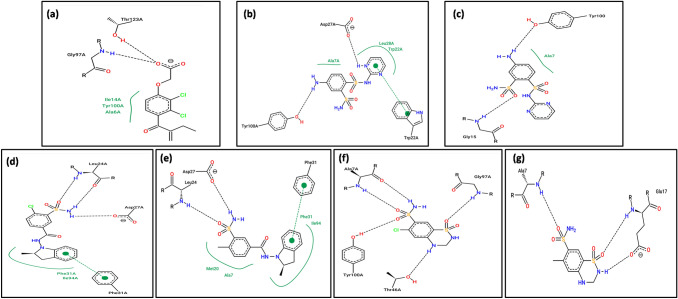
Fig. 3.
2D representation of interactions between residues of DHFR and drugs. a Ethacrynic acid, b, c Sulphadiazine, d, e Indapamide and f, g Hydrochlorothiazide. In (a, b, d and f) interactions after docking while in (c, e and g) interactions after 10 ns MD are represented. The arc represents the hydrophobic interaction. The pi-pi interaction if any, is also represented

