Figure 1.
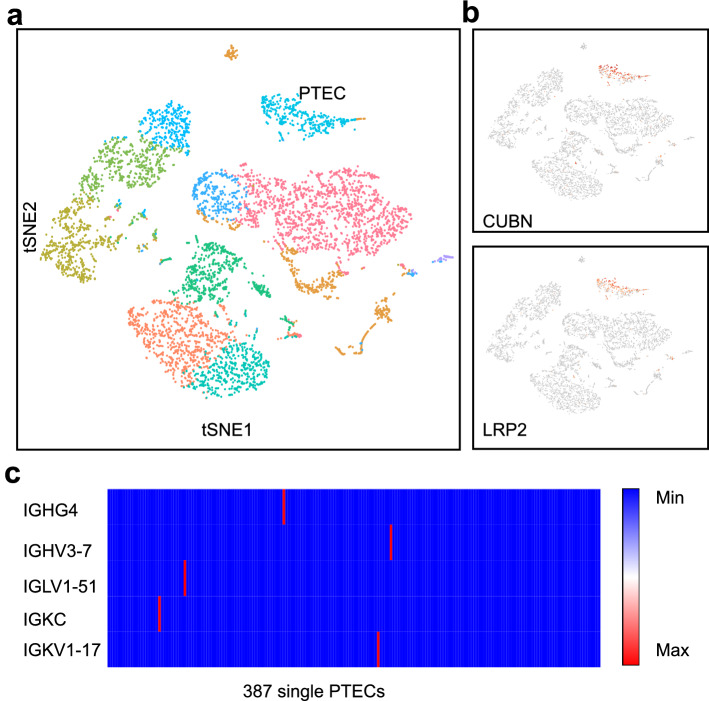
Few Ig transcripts were detected in PTECs by high-throughput single-cell sequencing. (a) The plot shows a two-dimensional representation (tSNE t-distributed stochastic neighbor embedding) of global relationships among 6138 single cells. A total of 11 clusters were identified, among which PTECs accounted for 6.1% (387/6138). Loupe Browser (version 4.0.0) was used for clustering. (b) Expression of PTEC marker genes (CUBN and LRP2) colored on the basis of normalized expression levels (gray, low; red, high). (c) Only five Ig transcripts were detected in five PTECs. The horizontal axis represents 387 single PTECs and the vertical axis represents five Ig genes (blue, no expression; red, expression).

