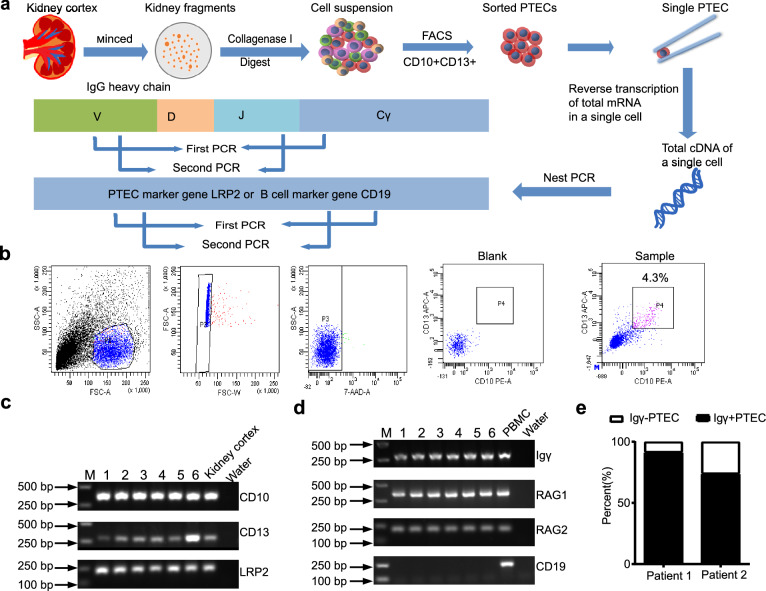
Figure 2.
Transcripts of the Igγ chain were detected in sorted PTECs by FACS. (a) Schematic overview of the single-cell sequencing workflow in PTECs. (b) PTECs were sorted by FACS using antibodies against CD10-PE and CD13-APC. FACS analysis revealed that 4.3% of cells were double-positive. (c) PCR analysis of three PTEC marker genes: CD10, CD13 and LRP2; cDNA from the kidney cortex was used as a positive control. (d) PCR analysis of Igγ, RAG1, RAG2 and the B cell marker gene CD19. Peripheral blood mononuclear cells (PBMCs) were used as the positive control. Water instead of cDNA was used as a negative control. The Numbers (1 to 6) refer to six randomly selected PTEC cells for presentation. The full-length gels were presented in Supplementary Fig. 1. (e) IgG positive detection rate in PTECs from 2 patients was 91.8%, 74.2%, respectively.

