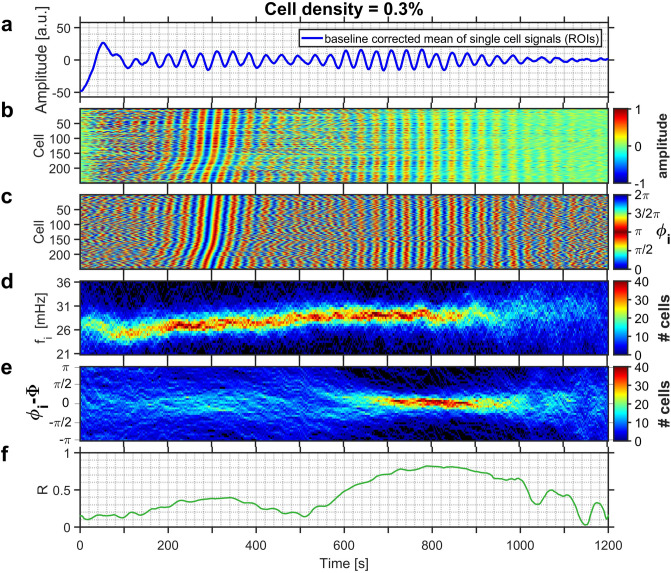
Figure 2.
(a) The time-series of the collective NADH fluorescence signal for a yeast population of cell density . Partial synchronisation of intracellular oscillations occurs at 580 s s. (b) Development of the relative amplitudes of oscillations of each cell, and (c) of their phases. In (b) and (c) the cells are sorted according to their phases at time s. (d) Evolution of the distribution of instantaneous frequencies of the cells, and (e) of the distribution of the phase difference between the phase of each individual cell to that of the average phase of all cells of the population. (f) Time dependence of the order parameter R. The field of view had a size of m and hosted 251 cells. Glucose was added to the cell suspension at s.

