Figure 3.
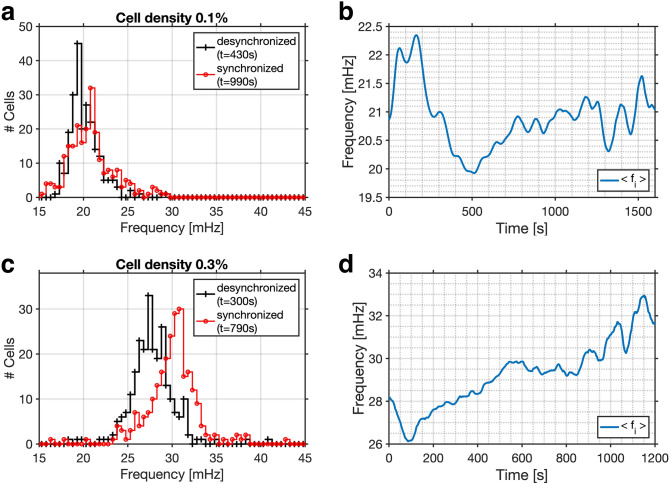
Evolution of the instantaneous frequencies. Upon partial synchronisation, the frequency distribution is shifted towards higher frequencies. (a, c) Histograms of the instantaneous frequencies of the oscillations of individual cells during asynchronous (desynchronized; black line) and partially synchronized (red line) oscillations. The instantaneous frequencies were binned into intervals of mHz. (b, d) Temporal evolution of the mean of the frequency distribution. In a population of (shown in Fig. 1), (a) the frequency distribution is shifted to slightly higher frequencies and its mean increases from (a) 20.0 to 21.0 mHz (at s and s, respectively). (b) Partial synchronisation is achieved as the mean of the frequency distribution reaches and remains on a plateau (from to 1100 s). In a population of (shown in Fig. 2), (c) the frequency distribution is shifted to slightly higher frequencies and its mean increases from (a) 27.5 to 30.0 mHz (at s and s, respectively). (d) Partial synchronisation is achieved as the mean of the frequency distribution reaches and remains on a plateau (from to 950 s).

