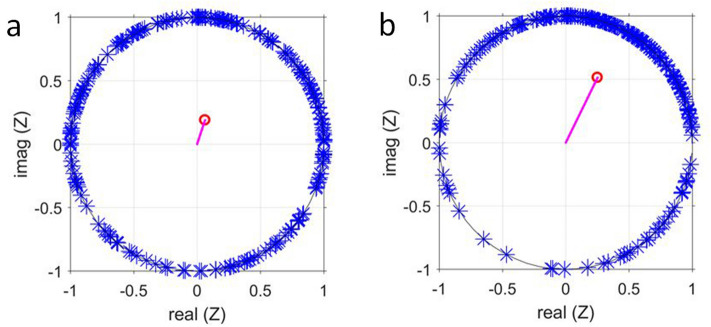
Figure 4.
The phases of the glycolytic oscillations of every cell of a population of cell density (Fig. 1) are plotted on the unit circle (a) during the regime of asynchronous oscillations at s and (b) during partial synchronisation at s. The position of the phase of each cell is marked by an asterisk. The vector starting at the origin points to the value of the average phase , and the magnitude of the vector corresponds to the value of the order parameter R (which is (a) and (b) , respectively).

