Figure 5.
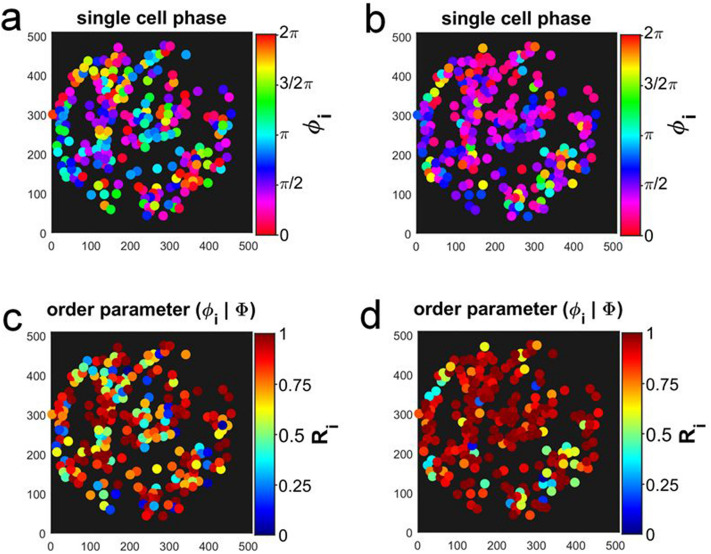
Spatial partition of the phases of the glycolytic oscillations of each cell (a) during asynchronous oscillations ( s) and (b) during the partially synchronized state (at s). Spatial partition of the relative order parameter (Eq. 6) (c) during the regime of asynchronous oscillations ( s) and (d) during the partially synchronized state (at s). Data from the experiment at cell density shown in Fig. 1. The field of view had a diameter of 169 m and it was binned into 512 512 pixels. Each pixel had a resolution of 0.33 m 0.33 m.

