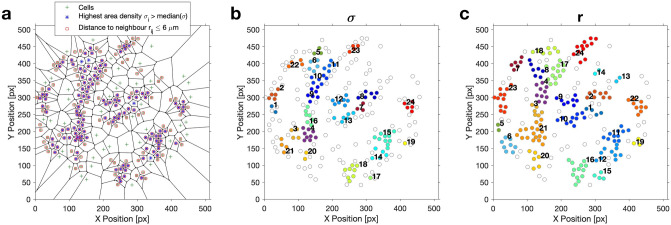
Figure 6.
Voronoi tessellation and segmentation of the cells into spatial clusters. Cell density: 0.1%. (a) In the Voronoi diagram, the positions of the centres of mass of the cells are indicated by green crosses; the cells displaying the highest relative cell area densities and those with the shortest intercellular distances m are indicated by blue asterisks and red squares, respectively. (b) Clusters obtained due to segmentation with respect to the (highest) relative cell area density and (c) with respect to the (shortest) intercellular distances . The field of view had a diameter of 169 m and it was binned into pixels. Each pixel had a resolution of 0.33 m 0.33 m.

