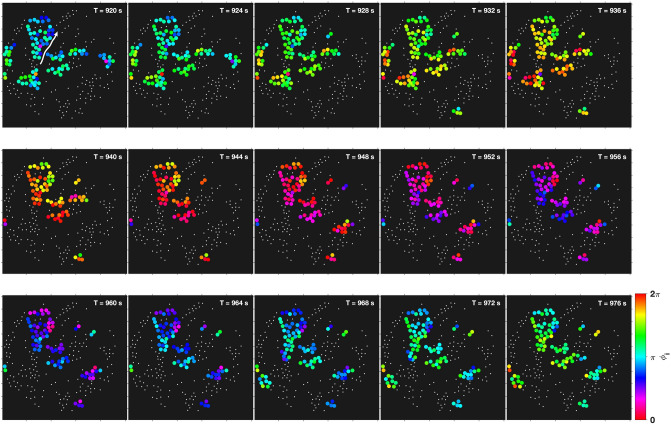
Figure 8.
Visualization of a glycolytic wave travelling in the cell population (see also Video S2). The wave propagates almost diagonally through the field of view, from the bottom left to the top right. Cells that lie closer to the bottom left are always slightly phase-advanced with respect to any other cell that is located closer to the top right. The phase gradient is also well developed in the central cluster (that reaches roughly from the top left to the centre of the field of view). The arrow in the top left panel is a guideline for the eye, indicating the direction of propagation of the glycolytic wave. The snapshots were taken at intervals of s, and the clusters obtained by segmenting with respect to the intercellular distance . The visualized cells displayed a local cluster order parameter of . The field of view had a diameter of 169 m and it was binned into 512 512 pixels. Each pixel had a resolution of 0.33 m 0.33 m.

