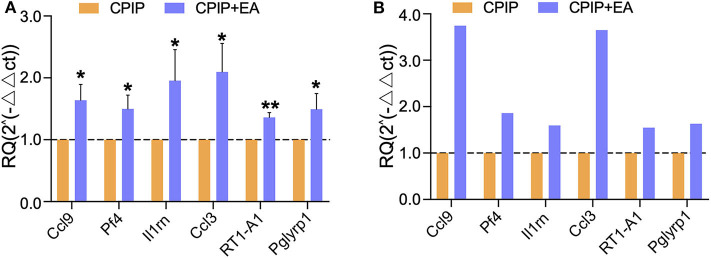
Figure 7.
The validation of RNA-Seq results using qPCR. (A) The expression of representative genes in immune response detected by qPCR. (B) The expression of representative genes by RNA-Seq. n = 7 rat/group. *p < 0.05 and **p < 0.01 vs. with CPIP group. Student's t-test was used for statistical analysis.

