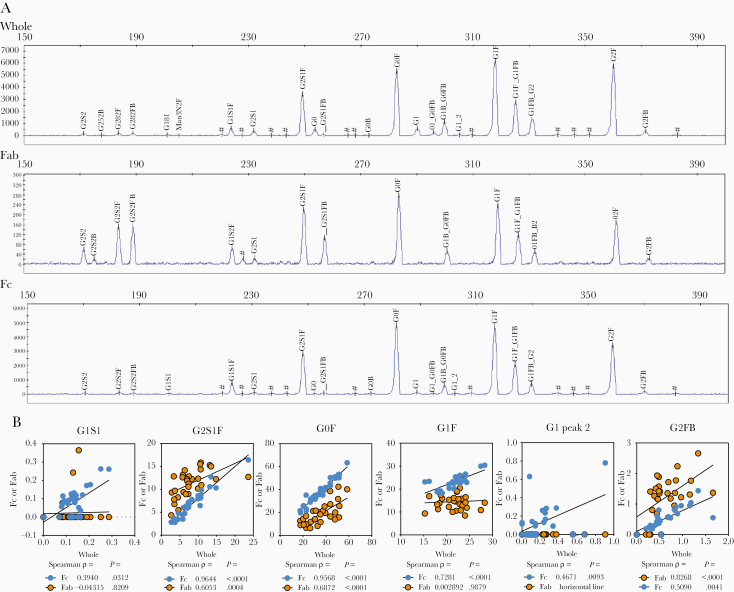
Figure 2.
Associations between Fc, Fab, and whole IgG glycans in tuberculosis. A, Representative plots generated via capillary electrophoresis of samples from individuals with latent (n = 10) or active (n = 20) tuberculosis are shown for glycans isolated from whole, Fab domain, and Fc domain IgG. Peaks are identified by alignment with standards and relative abundance is calculated by peak areas via GlycanAssure Data Acquisition Software v.1.0. B, Prominent peaks from the Fc and Fab domain were correlated by Spearman rank order to whole IgG. Rho (ρ) and P values are indicated. Abbreviations: G0, agalactosylated; G1, monogalactosylated; G2, digalactosylated.

