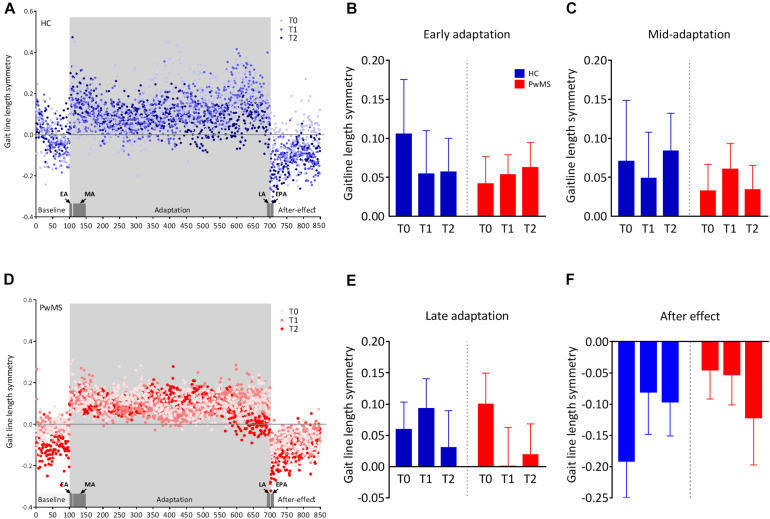
FIGURE 2.
Changes in the symmetry of gaitline length across training phases in experiment 1 (training without tDCS): (A,D) The changes in the mean gaitline symmetry for each training phase are illustrated with respect to the stride number for healthy controls (HC) and people with multiple sclerosis (PwMS). The first and last six strides of the adaptation period define the early, EA and the late adaptation, LA, respectively. The first six strides of the postadaptation period are called early postadaptation, EPA and the mid-adaptation, MA is the average of the 50 strides following EA. Dots represent the means of the calculated gaitline symmetry at each stride for the entire group (HC or PwMS). Training on the split-belt treadmill was performed at T0, T1 (24 h after the first trial) and T2 (72 h after the first trial). The blue color represents data from HC and red dots are data obtained from PwMS. (B) Average gaitline length symmetry in the early adaptation obtained from the first six strides in the adaptation phase. (C) Average gaitline length symmetry during mid-adaptation obtained from the first 50 strides following early adaptation in the adaptation phase. (E) Average gaitline length symmetry during late adaptation obtained from the last six strides in the adaptation phase. (F) Average gaitline length symmetry during early postadaptation obtained from the first six strides in the postadaptation phase of the training. Error bars represent the standard error of means (sem, N = 10 per group).

