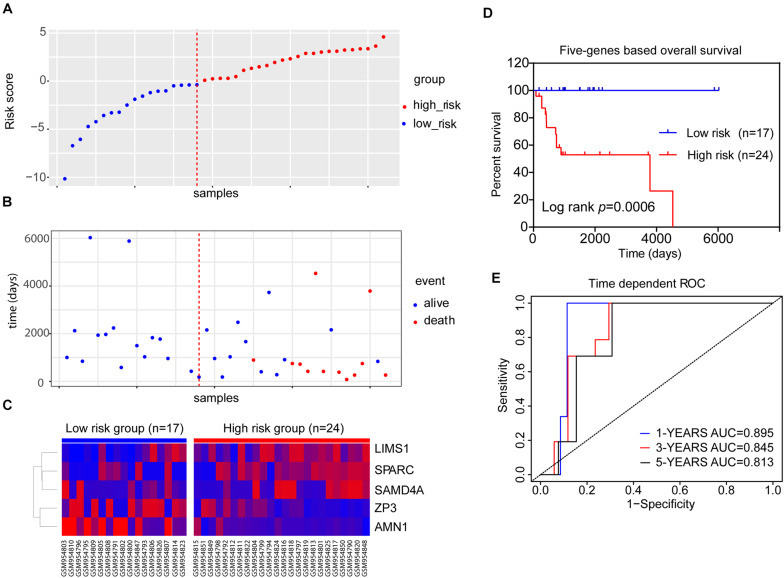
FIGURE 4.
The five-gene risk score model for the GSE39058 dataset (N = 41). (A) Scatter plot displaying the risk score of each patient in the GSE39058 dataset. Patients were divided into high- or low-risk groups according to the risk score. The blue plots represent the patients in the low-risk group (risk score ≤ 0), while the red plots represent patients in the high-risk group (risk score > 0). (B) The survival status distribution of patients with osteosarcoma in the high- or low-risk groups. (C) The expression status of the five prognostic genes in 41 patients with osteosarcoma in the GSE39058 dataset. (D) K–M survival curves showing the difference in OS between high- and low-risk patients (41 patients) (log-rank test, p = 0.0006). (E) Time-dependent ROC curve analysis for the prediction of survival using the five-gene prognostic model. The AUCs of 1-, 3-, and 5-year OS are shown in the figure. AUC, area under the curve; K–M, Kaplan–Meier; OS, overall survival; ROC, receiver operating characteristic.

