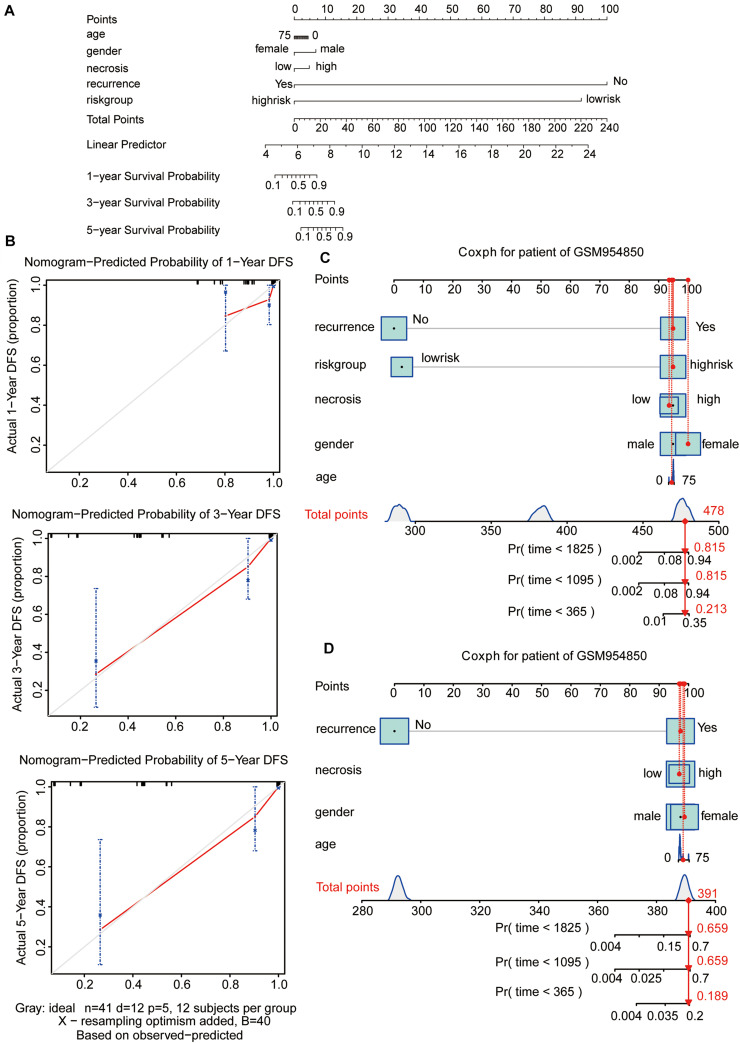
FIGURE 5.
Nomogram predicting the probability of 1-, 3-, and 5-year OS in patients with osteosarcoma. (A) Nomogram adding up the points identified on the points scale (the upward line) for each variable. The total points projected on the bottom scales indicate the probability of 1-, 3-, and 5-year OS. (B) Calibration plot for predicting the 1-, 3-, and 5-year OS. The gray line represents the ideal condition. (C,D) The nomograms predicting the probability of 1-, 3-, and 5-year OS for the specific patient GSM954850 based on the model containing or not containing the risk group in the GSE39058 dataset. OS, overall survival; DFS, disease-free survival.

