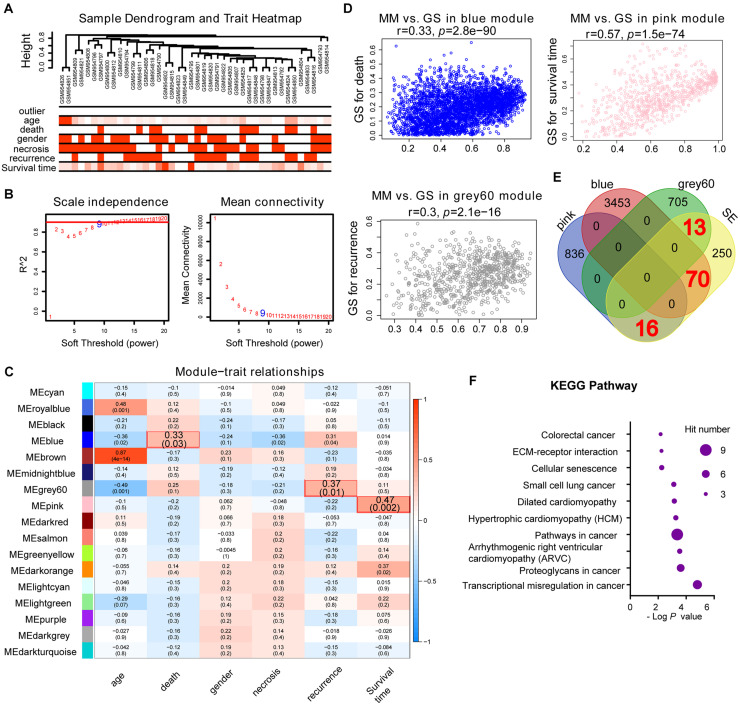
FIGURE 6.
Identification of SE-related hub genes in osteosarcoma based on the GSE39058 dataset through WGCNA analysis. (A) Cluster analysis between the gene expression in the GSE39058 dataset and sample outliers or clinical traits. Color intensity was proportional to sample outliers, age, gender, necrosis, recurrence, and survival time. (B) Analysis of the scale independence and mean connectivity (vertical axis) for various soft-thresholding powers (β value of horizontal axis). (C) Heatmap of the correlation between modules and clinical traits of osteosarcoma; p-values in the table specify the correlation between modules and clinical traits. Three modules had high correlation with clinical traits: MEgray60 with recurrence (r = 0.37, p = 0.01); MEblue with death (r = 0.33, p = 0.03); and MEpink with survival time (r = 0.47, p = 0.002). (D) Scatterplot showing the MM versus GS of module genes related to death in the blue module, recurrence in the gray60 module, or survival time in the pink module (horizontal axis: MM means module membership, vertical axis: GS means gene significance). (E) Venn plot of SE-related genes and eigengenes in the blue, gray60, and pink modules. There are 70, 13, and 16 correlated genes, respectively. (F) KEGG pathway analysis of the above-correlated genes in the Venn plot. KEGG, Kyoto Encyclopedia of Genes and Genomes; SE, super-enhancer; WGCNA, weighted gene co-expression network analysis.

