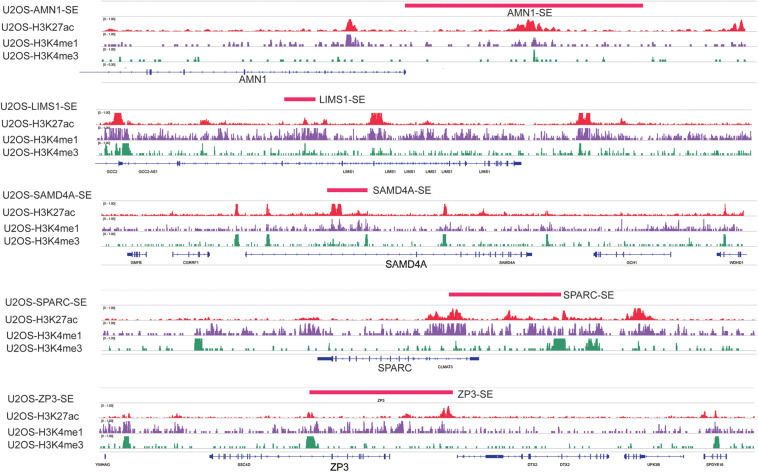
FIGURE 7.
Signal tracks for H3K27ac (red), H3K4me1 (purple), and H3K4me3 (green) ChIP–seq profiles of the five-SE-associated hub genes visualized using IGV. The regions of SE are shown in a pink bar upon the signal tracks. ChIP–seq, chromatin immunoprecipitation–sequencing; SE, super-enhancer; IGV, Integrative Genomics Viewer.

