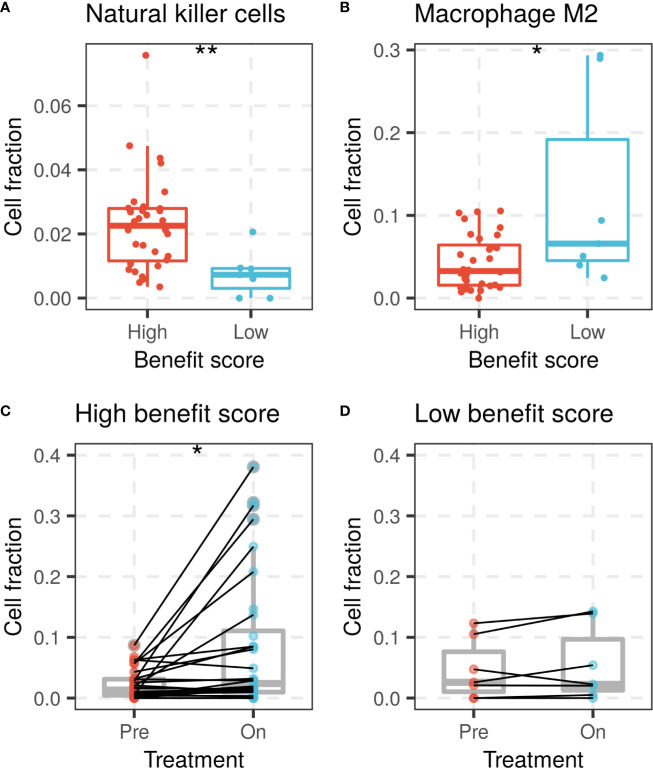
Figure 4.
NK cells and macrophage M2 fractions of patients between high and low benefit score groups in the Riaz cohort. (A) NK cell fraction of patients grouped by benefit score is shown by a box plot at left, while (B) the macrophage M2 fraction is shown on the right side. CD8 T cell fraction change during ICI treatment in (C) high benefit score group and (D) low benefit score group. (*p < 0.05, **p < 0.01).

