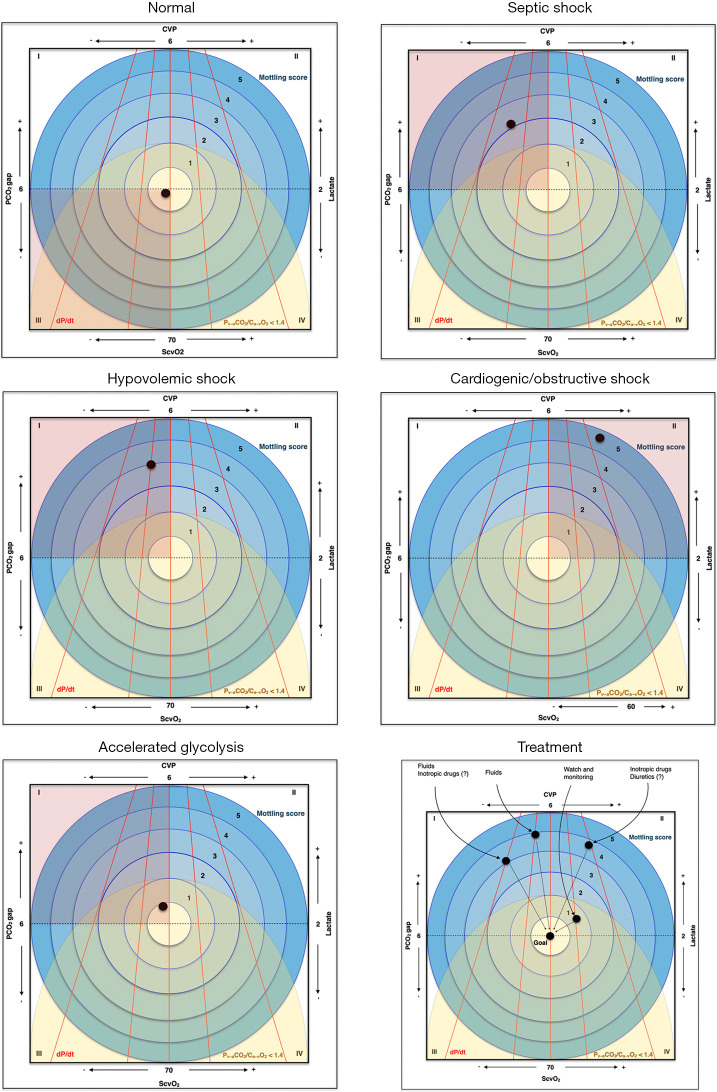
Figure 1.
Understanding hemodynamics with seven variables. The ScvO2, Lactate, CVP and PCO2 gap are shown on each side of the square; dP/dt is represented by red lines (and the different slopes represent how fast the pressure is reached), the Mottling score is represented by blue circles, each one reflecting a score and the Pv–aCO2/Ca–vO2 <1.4 is identified by a yellow semicircle, the points within this area mean a ratio less than 1.4. The position of the black dot represents a clinical presentation of each of the situation described, and in the graph at the bottom right, we presented the change of the hemodynamic parameters after interventions aiming for the resolution of septic shock. ScvO2, oxygen saturation of the central venous blood; O2, oxygen; PCO2 gap, central venous-to-arterial carbon dioxide tension difference; CVP, central venous pressure; Pv–aCO2/Ca–vO2, ratio of the venous-to-arterial carbon dioxide tension difference over the arterial-to-venous oxygen content difference; dP/dt, rate of change in pressure with time.

