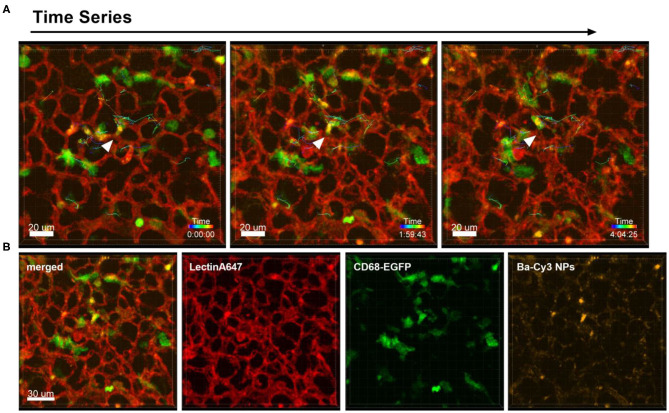
Figure 3.
Uptake of NPs by monocytes and their tracking. Representative confocal images of a lung lobe from a CD68-EGFP mouse (macrophages and monocytes green). Lectin-A647 for visualization of blood vessels (red) and Ba-Cy3 NPs (yellow) were injected i.v. 5 min before sacrifice. (A) Representative frames of a time series over 4 h at an interval of 300 s showing the trajectory of individual monocytes. Scale bar represents 20 μm. (B) shows the co-localization of the Ba-Cy3 NPs with the CD68-EGFP positive monocytes within blood vessels. Images show the overlay (merged) of Lectin-A647 (red), CD68-EGFP cells (green), and Ba-Cy3 NPs (yellow). Scale bar represents 30 μm.

