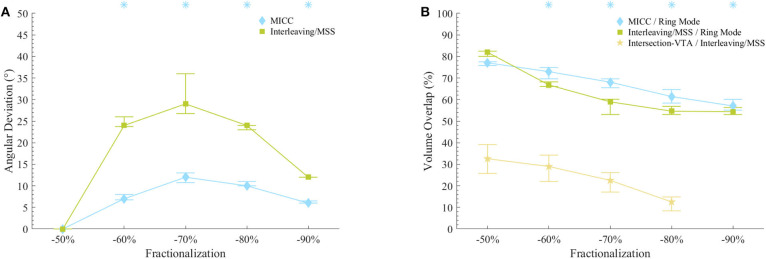
Figure 3.
VTAs characterization for fractionalizations. (A) VTA deviations from the expected rotation angles for MICC and Interleaving/MSS. Asterisks indicate fractionalizations for which MICC had significantly lower (p < 0.05) angle deviations compared to Interleaving/MSS. (B) VTA volume overlap ratio for MICC/ring mode, Interleaving/MSS/ring mode and Intersection VTA/Interleaving/MSS. For the fractionalization −90%/−10%, Interleaving/MSS always failed to produce VTA 2 and therefore, there was no Intersection VTA. Asterisks indicate fractionalizations for which MICC had significantly higher (p < 0.05) overlap ratio compared to Interleaving/MSS. On both plots, markers indicate the median value across all analyzed VTA radii, whereas bars indicate the (25–75%) IQR. Fractionalization percentages indicate the activation of the dominant electrode (Table 1 E2).

