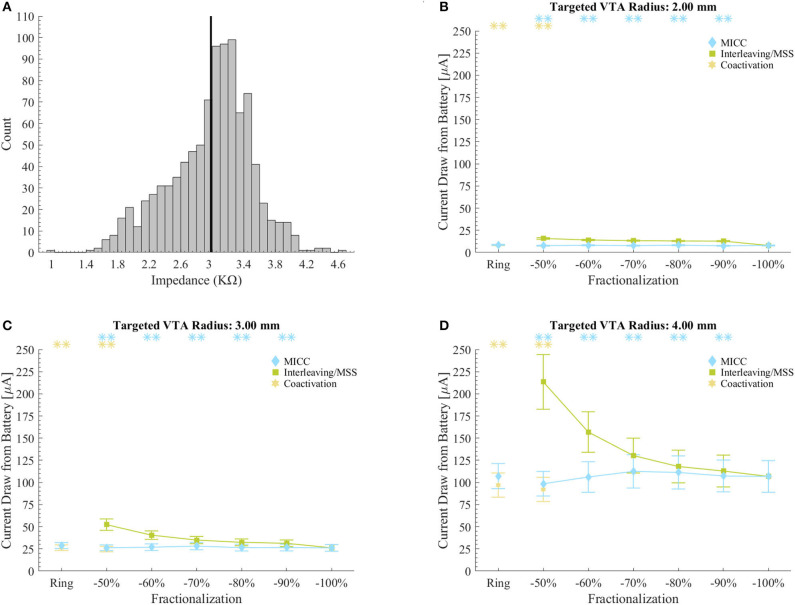
Figure 5.
Current draw from battery for clinical impedance measurements. (A) Histogram of the impedance values in the set of 980 clinical measurements. The vertical black line shows the mean impedance value. Impedance values were normally distributed (Kolmogorov-Smirnov-test, p < 0.001). (B–D) Current draw from battery for MICC, Interleaving/MSS and coactivation settings for VTAs radii of 2.00, 3.00, and 4.00 mm. Values were calculated based on the set of 980 impedance measurements. Calculations were done across the possible electrode permutations for the analyzed fractionalizations, where markers indicate the mean and bars indicate ± standard deviation. Asterisks indicate fractionalizations for which MICC had highly significantly lower (p < 0.001) current draw from battery compared to Interleaving/MSS (blue) or coactivation had highly significantly lower (p < 0.001) current draw from battery compared to MICC (yellow). Fractionalization percentages indicate the activation of the dominant electrode (Table 1 E2).

