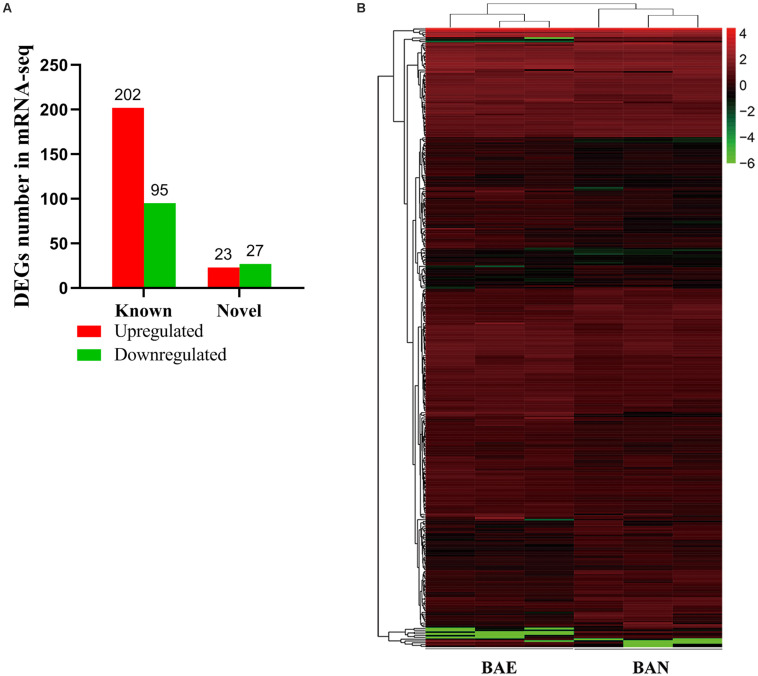
FIGURE 1.
Blast Analysis of Transcriptome from RNA-seq. (A) The quantity statistics of DEGs, in which the red column representing upregulated DEGs and the green representing downregulated DEGs. (B) Heatmap of 347 differentially expressed genes (DEGs) between BAE and BAN, in which rows representing genes and columns representing different groups.

