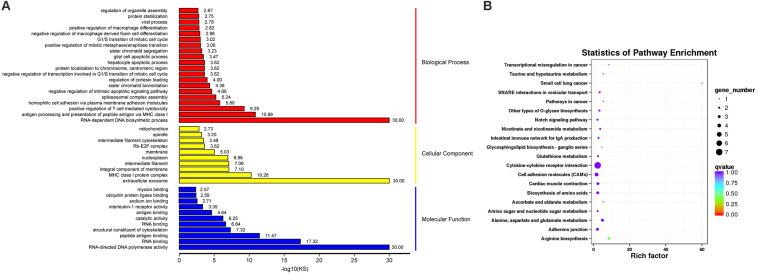
FIGURE 3.
GO and KEGG Analysis for DEGs. (A) The top GO terms for DEGs, in which rows representing GO terms and columns representing the value of “–log10(KS)”. (B) The top 20 enriched pathways in KEGG pathway analysis for DEGs, in which rows representing pathways and columns representing the percentage (%) of rich factor.

