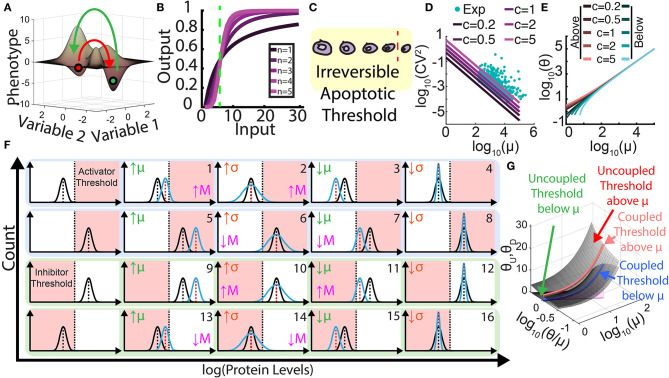
Figure 1.
Role of heterogeneity and its control in threshold crossing and metastasis. (A) Multistable landscape illustrating two steady states (phenotypes). Red arrow represents going from the first phenotype to the second across the crest (threshold), and the green arrow represents the reverse transition. (B) Ultrasensitivity is the abrupt change in output for small input changes, captured by Hill functions with high Hill coefficients, n ≥ 2. Green line represents threshold where the system is most sensitive to input. (C) Irreversibility stems from a physical or chemical threshold that acts as a point of no return when cells surpass it. (D) Graph illustrating the natural tendency of gene expression noise [coefficient of variation squared (CV2)] to decrease hyperbolically as mean levels increase: CV2 = c/mean. The values of c ≠ 1 correspond to non-Poisson behaviors, such as bursting (c > 1) or noise suppression (c < 1, e.g., by negative feedback). Teal scatter dots represent rescaled yeast experimental data (Newman et al., 2006) illustrating the natural tendency of coupling between the CV and the mean for hundreds of genes. (E) Graph of threshold levels θ that can be crossed as a function of mean protein levels μ, with natural mean-noise coupling for bursting parameter c. Orange colors represent downward threshold crossing (heuristically, θ < μ – σ) when the mean is above the threshold, whereas the blue colors represent upward threshold crossing (θ > μ + σ) when the mean is below the threshold. (F) Threshold crossing effects of independently changing the mean μ or standard deviation σ for four starting positions of cell populations relative to phenotypic thresholds. The graphs with blue background (1–8) relate to metastatic activator levels, while the graphs with green background (9–16) relate to metastatic inhibitor levels. Pink areas represent metastasis (M), while white areas represent no metastasis, with pink arrows indicating increased or decreased likelihood. (G) Landscapes and curves illustrating phenotypic threshold levels that can be overcome (crossed) when the noise (CV) and mean (μ) vary in a coupled or uncoupled manner, respectively. The higher surface corresponds to upward threshold crossing [top and bottom rows of (F), 1–4 and 13–16], while the lower surface corresponds to downward threshold crossing [middle rows of (F), 5–8, 9–12 ]. Thresholds crossed by naturally coupled mean and noise values are overlaid on each surface as blue and orange lines.

