
Figure 4.
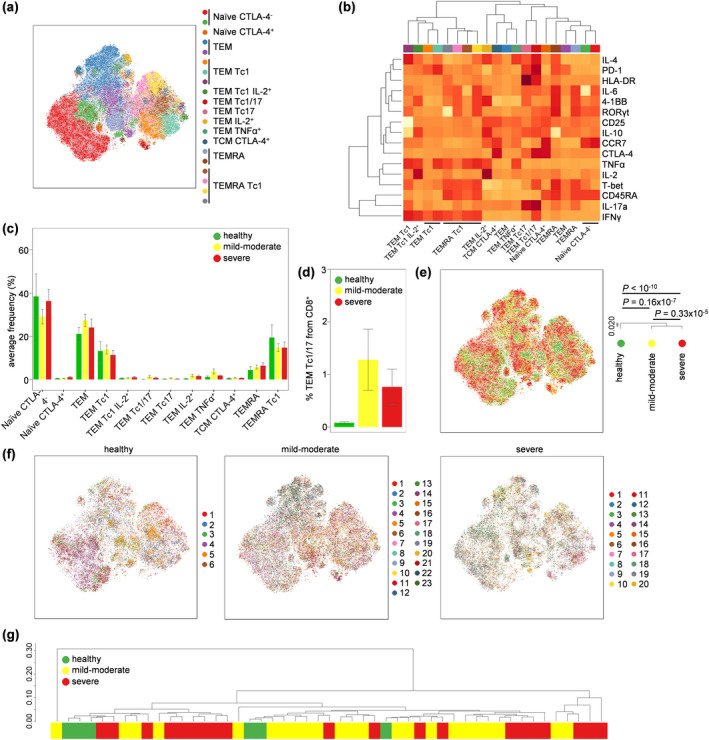
Profound activation of CD8+ T cells in both severe and moderate COVID‐19. PBMCs were isolated from healthy controls (n = 6), mild‐to‐moderate COVID‐19 patients (n = 23) and severe COVID‐19 patients (n = 20), stimulated and assessed through flow cytometry. CD3+CD14−CD4−CD8+ T cells were manually gated in FlowJo. (a) tSNE representation of CD8 T‐cell cluster populations based on the expression of phenotypic markers: CD45RA, CCR7, 4‐1BB, CD25, CTLA‐4, HLA‐DR, IFNγ, IL‐2, IL‐4, IL‐6, IL‐10, IL‐17a, PD‐1, RORγt, T‐BET and TNFα. FlowSOM clusters were annotated based on (b) expression of phenotypic markers across each cluster (see also Supplementary figure 4). (c) Quantification of CD8 T‐cell subsets in healthy, moderate COVID‐19 patients and severe COVID‐19 patients. (d) Detailed depiction of TEM Tc1/17 from CD8+ cells in healthy, mild‐to‐moderate COVID‐19 and severe COVID‐19 patients. (e) tSNE representation of PBMC populations based on aforementioned phenotypic markers for each condition, namely healthy controls, mild‐to‐moderate COVID‐19 and severe COVID‐19 patients. The dendrogram shows the comparative similarity based on the Kolmogorov–Smirnov statistic calculated using the cross‐entropy distributions derived from tSNE. (f) tSNE representation of PBMC populations based on aforementioned phenotypic markers for each condition, namely healthy controls, mild‐to‐moderate COVID‐19 and severe COVID‐19 patients, with each individual represented in a different colour. (g) Dendrogram showing the comparative similarity between individuals based on the Kolmogorov–Smirnov statistic calculated using the cross‐entropy distributions derived from tSNE. Mean ± SEM.