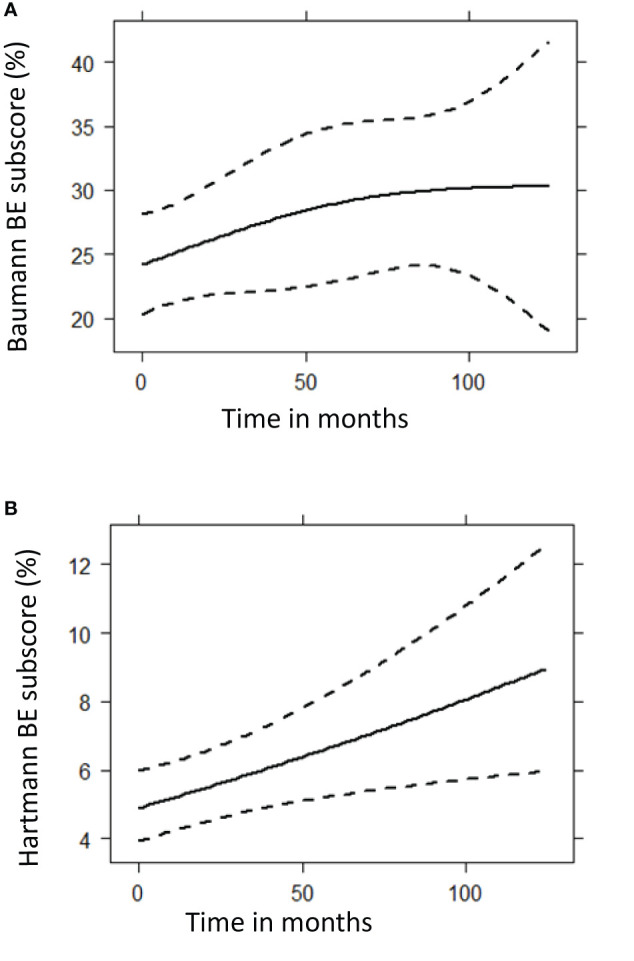
Figure 6.

Prediction plots of bronchiectasis (BE) component scores from mixed-effects model analysis. These graphs show the predicted progression in computed tomography BE component scores (%) over time (months) for the Baumann (A) and Hartmann (B) scoring method, using mixed model analysis. A total of 299 CT scans were used for this follow up analysis. The Baumann BE component score showed no significant change over time (p = 0.1248), while the squared root of Hartmann BE score increased significantly (p = 0.0097). (A) Baumann BE component score. (B) Hartmann BE component score.
