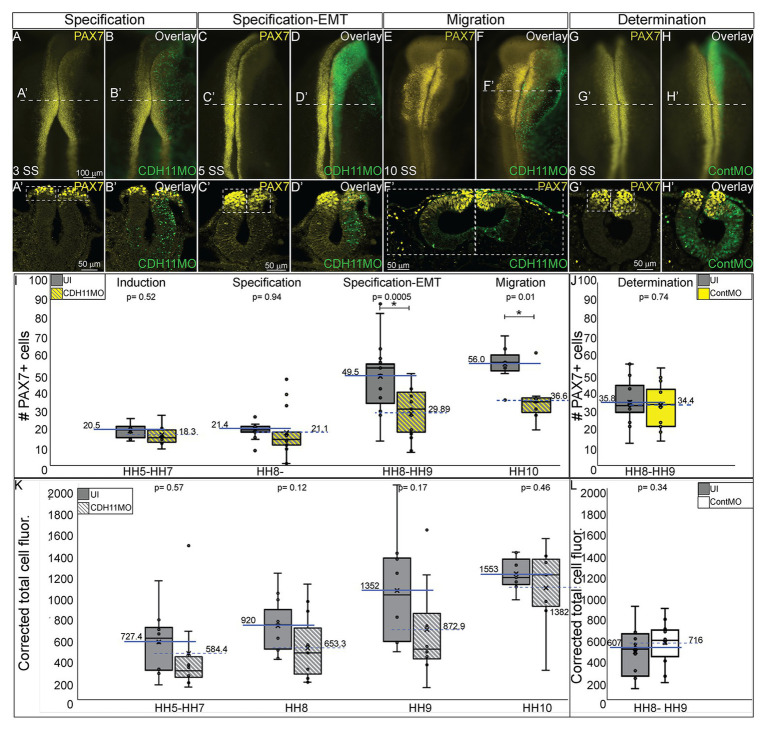
Figure 2.
CDH11 is required for NC cell population specification. Embryos were injected at HH4 and collected at multiple stages to analyze NC progenitor marker, PAX7. (A-F’) IHC for PAX7 on embryos injected with CDH11MO and collected between 3 SS and 10 SS. (G–H’) IHC for Pax7 in embryo injected with ContMO and collected at 6 SS. (I,J) Actual PAX7+ cell counts of uninjected and morpholino-injected sides. (K) Corrected total cell fluorescence of PAX7 expression in section images injected with either CDH11MO or ContMO. (A) Whole mount IHC for PAX7 in HH8‐ (3 SS) embryo with (B) overlay with CDH11MO (green). (A’,B’) Transverse section of (A,B) with PAX7-positive NC cells circled. Mean number of cells at HH8‐ is 21.43 on uninjected and 21.14 on CDH11MO-injected side, p = 0.94, n = 14. (C) Whole mount IHC for PAX7 in HH8 embryo with (C) overlay with CDH11MO (green). (C’,D’) Transverse section of (C,D) with PAX7-positive NC cells boxed. Mean number of cells at HH8 is 49.53 on uninjected and 29.89 on CDH11MO-injected side, p = 0.0005, n = 19. (E) Whole mount IHC for PAX7 in HH10 embryo with (F) overlay with CDH11MO (green). (F’) Transverse section of (F) with PAX7-positive NC cells. Mean number of cells at HH10 is 56.00 on uninjected and 36.57 on CDH11MO-injected side, p = 0.01, n = 7. (G) Whole mount IHC for PAX7 in HH8 embryo with (H) overlay with ContMO (green). (G’,H’) Transverse sections of (G,H) with PAX7-positive NC cells circled. Mean number of cells on uninjected side is 35.8 and on ContMO-injected side is 34.4, p = 0.74, n = 14. Dashed boxes were drawn around NC cell population from uninjected side and are mirrored on injected sides to demonstrate changes in the NC cell population density. At 5 SS the NC cell population is less dense in the CDH11MO-side compared to uninjected when compared to 3 SS and ContMO-injected embryos. (K,L) Fluorescence intensity calculated using NIH ImageJ (see methods) from HH5 (n = 8, p = 0.57), HH8 (N = 11, p = 0.11), HH9 (n = 8, p = 0.17), HH10 (n = 7, p = 0.46), and ContMO HH8–9 (n = 12, p = 0.34). Scale bars are as marked (100 μm for whole mount and 50 μm for sections). Anterior to top in all whole mount images, dorsal to top in all sections. Loss of CDH11 reduces the PAX7-positive NC cell population after induction (I, HH5-3SS) and at a point between specification and determination (5 SS).

