
Figure 5.
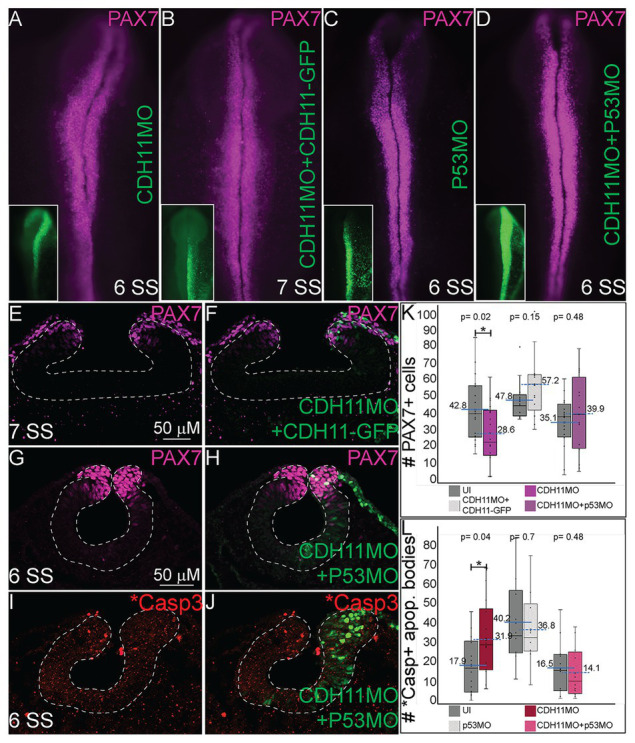
Blocking p53-mediated apoptosis rescues the NC fate. To determine if the NC and *Casp3 phenotypes resulted from p53-mediated apoptosis, embryos were injected with multiple combinations of treatments to attempt to rescue the phenotype. (A–D) Whole mount IHC for PAX7 in HH8‐ HH9 embryos after (A) CDH11MO, (B) CDH11MO + CDH11-GFP, (C) p53MO, or (D) CDH11MO + p53MO. Inset shows treatment injection (green). (E) IHC for PAX7 in transverse section from HH9 embryo with (F) overlay with CDH11MO + CDH11-GFP (green). (G) IHC for PAX7 in transverse section from HH9 embryo with (H) overlay with CDH11MO + p53MO (green). (I) IHC for *Casp3 in transverse section from HH8 embryo with (J) overlay with CDH11MO + p53MO (green). (K) Graph showing difference in PAX7 expression between uninjected and injected sides. Mean number of PAX7+ cells is 42.8 on uninjected and 28.6 on CDH11MO-injected side, p = 0.02, n = 18. Mean number of PAX7+ cells is 47.77 on uninjected and 57.23 on CDH11MO + CDH11-GFP-injected side, p = 0.15, n = 13. Mean number of PAX7+ cells is 35.06 on uninjected and 39.94 on CDH11MO + p53MO-injected side, p = 0.48, n = 16. (L) Graph showing difference in *Casp3 expression between uninjected and injected sides. Mean number of *Casp3+ cells is 17.90 on uninjected and 31.86 on CDH11MO-injected side, p = 0.04, n = 14. Mean number of *Casp3 + cells is 40.20 on uninjected and 36.80 on CDH11MO + CDH11-GFP-injected side, p = 0.71, n = 10. Mean number of *Casp3 + cells is 16.50 on uninjected and 14.17 on CDH11MO + p53MO-injected side, p = 0.68, n = 12. All graphs show mean (indicated on graph) and median (line within graph). Phenotypes were rescued by co-injection with full length CDH11 as well as by blocking p53 translation suggesting that the NC phenotype is due to cell death after loss of CDH11. Scale bars for (E,F) are as marked in (E) and (G-J) are marked in (G).