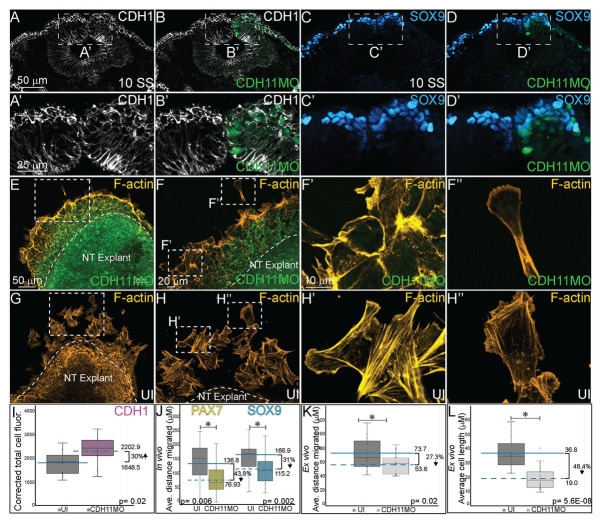
Figure 6.
CDH11 knockdown affects cell morphology and NC cell migration. To determine if the NC determination and cell death phenotype affects cell morphology in vivo (A–D’) embryos were injected unilaterally with CDH11MO and electroporated at HH4, and IHC was performed for (A–B’) CDH1 to mark epithelial cells and (C–D’) SOX9 to mark definitive NC cells. Dashed boxes in (A-D) indicate location of zoom in from (A’–D’).To determine if the CDH11 knockdown phenotype affects cell morphology and migration ex vivo (E–H”) neural tube explants were dissected from HH8 embryos, cultured on fibronectin coated slides, and stained for filamentous actin (F-actin). (A) IHC for CDH1 in transverse section from 10 SS embryo with (B) overlay with CDH11MO (green). (A’) Zoom in of dashed box from (A) showing increased CDH1 expression in dorsal neural tube in CDH11MO-injected versus uninjected side. (B’) Overlay with CDH11MO. (C) IHC for SOX9 in transverse section from the same 10 SS embryo from (A) with (D) overlay with CDH11MO (green) demonstrating reduced migration on CDH11-injected side. (C’,D’) Zoom in of dashed box from (C,D). (E-F”) Staining for F-actin in explant from embryo unilaterally injected with CDH11MO and electroporated at HH4, at (E) 20X and (F) 40X magnification. (F’) Zoom in of single follower cell from CDH11MO-injected explant. (F”) Zoom in of single leading cell from CDH11MO-injected explant. Both cells are significantly closer to epithelial explant and smaller than uninjected cells. (G–H”) Staining for F-actin in explant from uninjected side at (G) 20X and (H) 40X magnification. (H’) Zoom in of grouped follower cells from uninjected explant. (H”) Zoom in of single leading cell from uninjected explant. (I) Graph showing in vivo difference in CDH1 between uninjected and CDH11MO-injected sides. Corrected mean total cell fluorescence of CDH1 in the dorsal neural tube is 1645.5 on uninjected and 2202.9 on CDH11MO-injected side, p = 0.02, n = 11. (J) Graph showing difference in migration in vivo from midline of PAX7 and SOX9-positive cells between uninjected and CDH11MO-injected sides. Average distance migrated away from midline by PAX7+ cells is 136.8 μm on uninjected and 76.93 μm on CDH11MO-injected side, p = 0.006, n = 11 cells. Average distance migrated away from midline by SOX9+ cells is 166.87 μm on uninjected and 115.22 μm on CDH11MO-injected side, p = 0.002, n = 19. (K) Graph showing average distance migrated ex vivo by cells from explant is 73.7 μm from uninjected explant and 53.6 μm from CDH11MO-injected explant, p = 0.02, n = 17 cells. (L) Graph showing average cell length is 36.8 μm in uninjected explants and 19.0 μm in CDH11MO-injected explants, p = 5.6E-08, n = 23 cells. Overall, loss of CDH11 significantly reduces NC cell population, affects their morphology, and reduces cell migration as a result. All graphs show mean (indicated on graph) and median (line within graph). Scale bars for (A-D) are as marked in (A), (A’,B’) are marked in (A’), (E,G) are marked in (E), (F,H) are marked in (F), and (F’–H”) are marked in (F’).

