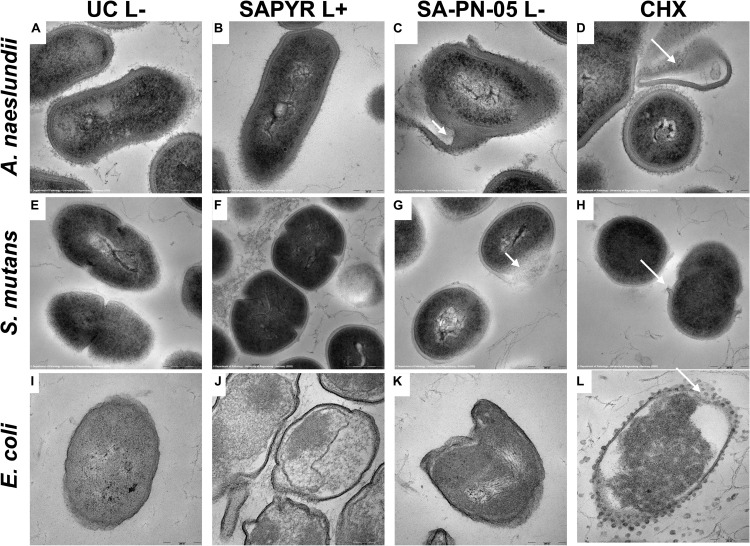
FIGURE 5.
Exemplary visualization of single-species biofilms by means of transmission electron microscopy (TEM). Visualization of single-species biofilms (A–D) A. naeslundii, (E–H) S. mutans, and (I–L) E. coli (48 h), either untreated (UC L–) or treated with aPDT using SAPYR (L+; 100 μM); SA-PN-05 (L–; 100 μM); or CHX (L–; 0.2%), at an original magnification of 100,000–fold (scale bar ∼ 200 nm). White arrows depict alterations in membrane structure.

