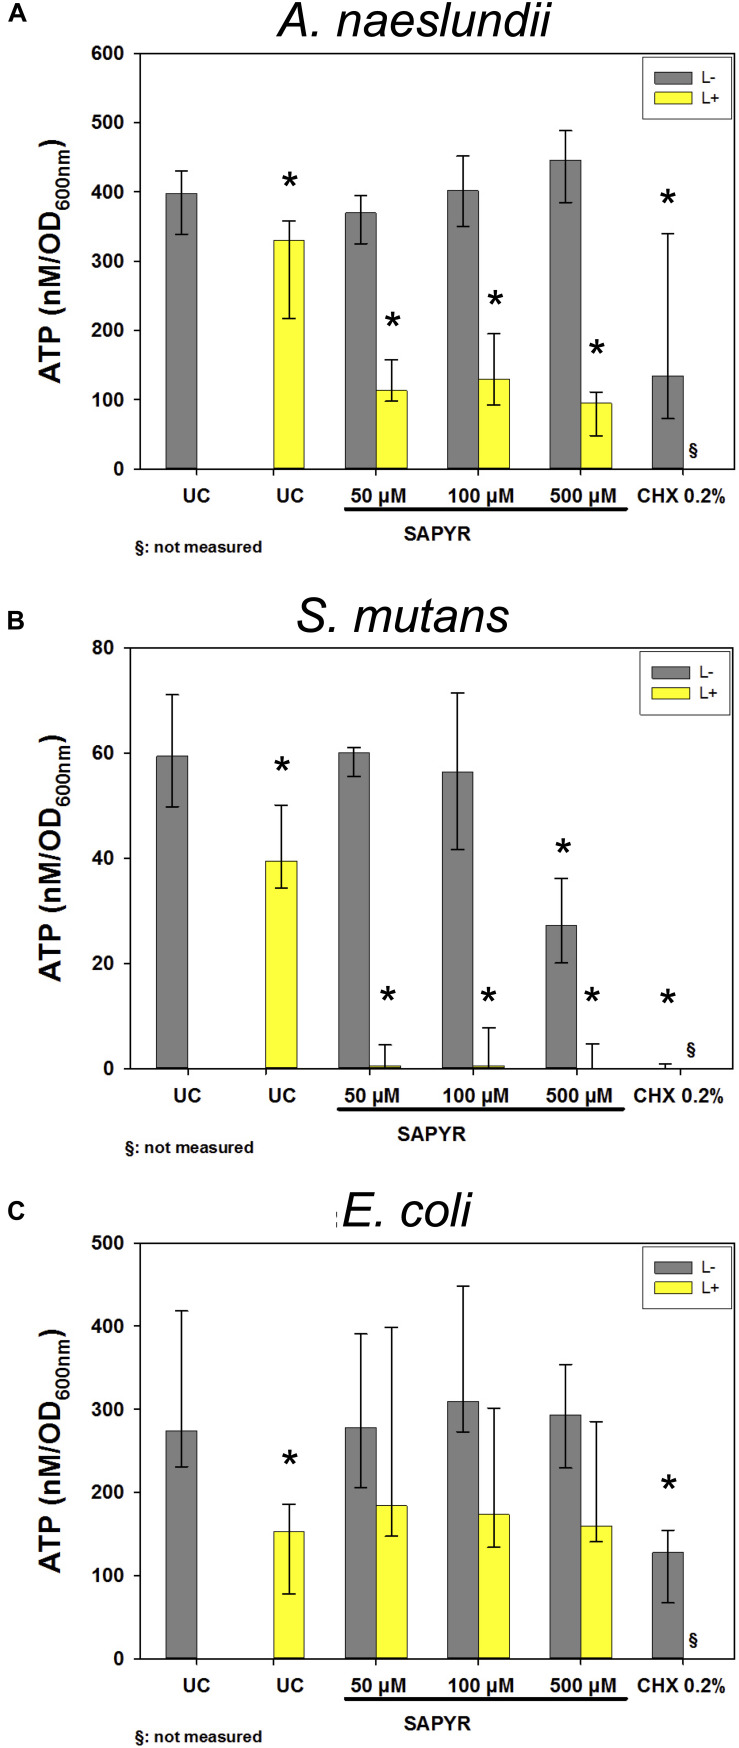
FIGURE 6.
Luminescence measurements for ATP level upon treatment with aPDT using SAPYR or CHX. Depicted are medians, 1st and 3rd quartiles of bacteria treated with SAPYR or CHX. ATP concentration was normalized to corresponding OD measurements of samples after treatment and expressed as ATP (nM/OD600) (A) A. naeslundii after 20 min incubation. (B) S. mutans after 5 min incubation. (C) E. coli after 5 min incubation. Yellow bars (L+) represent groups treated with SAPYR irradiated for 10 min. Gray bars (L–) represent dark controls or CHX, respectively. Asterisk depict statistical difference (p ≤ 0.05) among UC L– and treated groups. §, not measured. n = 4.

