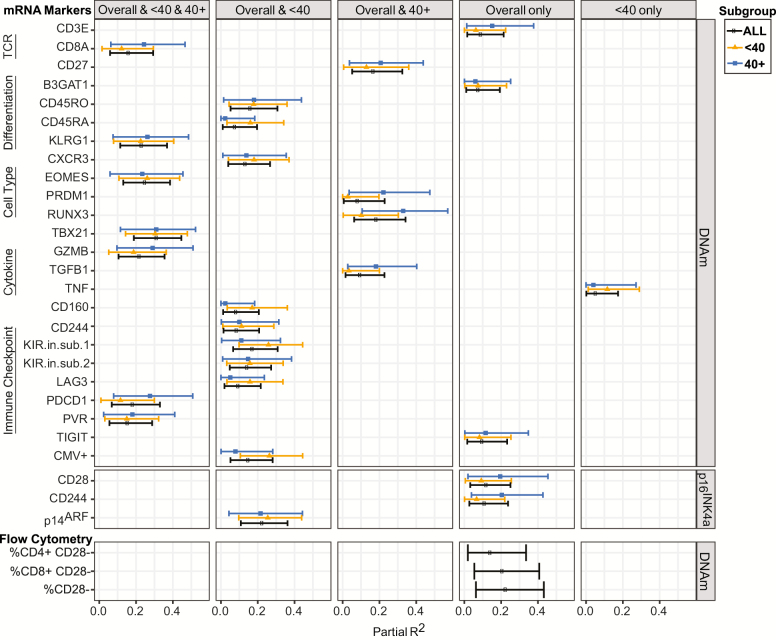
Figure 1.
Significant correlations between study measures and aging biomarkers. Linear mixed models, adjusting for sex, chronological age, and couple, were used to calculate the correlation (partial R2) between each study measure and DNAm or p16INK4a. Relationships were assessed in all study participants (overall), those under 40 years of age (<40), and those 40 years and older (40+). Values are graphed in columns according to the subgroups where statistical significance was achieved (adjusted p < .05). Points represent the estimated partial R2 with bars indicating the 95% confidence intervals. A complete listing of all study relationships appears in Supplementary Table S2.

