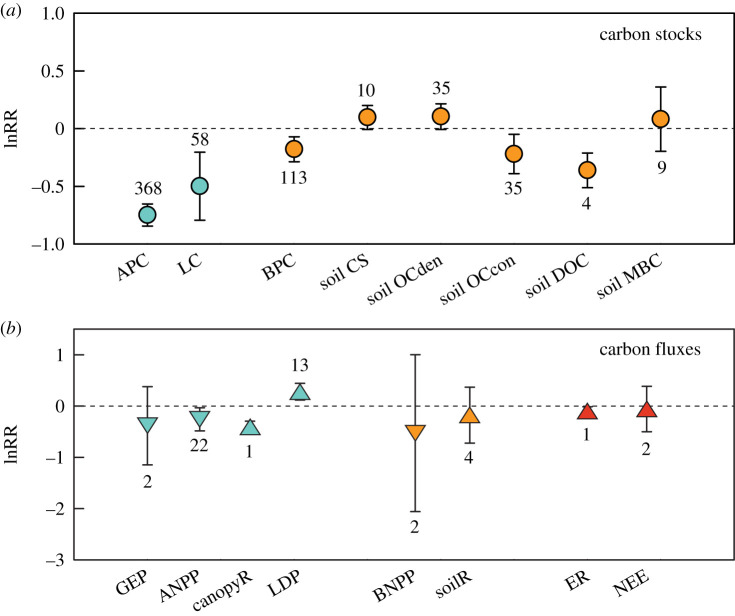
Figure 1.
Herbivore effects on the carbon cycle in coastal wetland ecosystems. (a) Measures of carbon stocks and (b) measures of carbon fluxes. Shown are mean log response ratios (lnRR) estimated with random-effects models. Error bars are 95% confidence intervals. Sample sizes for each carbon cycle measure are also shown. Effect sizes are significant when their 95% confidence intervals do not cross zero. Aboveground, belowground and whole-ecosystem carbon measures are indicated with cyan, orange and red symbols, respectively. In (b), for downward triangles, negative and positive effect sizes indicate that herbivores reduce and promote carbon absorption, respectively; for upward triangles, negative and positive effect sizes indicate that herbivores reduce and promote carbon emission, respectively. APC, aboveground plant carbon; BPC, belowground plant carbon; LC, litter carbon; soil CS, soil carbon stock; soil OCden, soil organic carbon density; soil OCcon, soil organic carbon concentration; soil MBC, soil microbial biomass carbon; soil DOC, soil dissolved organic carbon; GEP, gross ecosystem photosynthesis; ANPP, aboveground net primary production; BNPP, belowground net primary production; LDP, litter decomposition; canopyR, canopy respiration; soilR, soil respiration; ER, ecosystem respiration; and NEE, net ecosystem exchange. (Online version in colour.)

