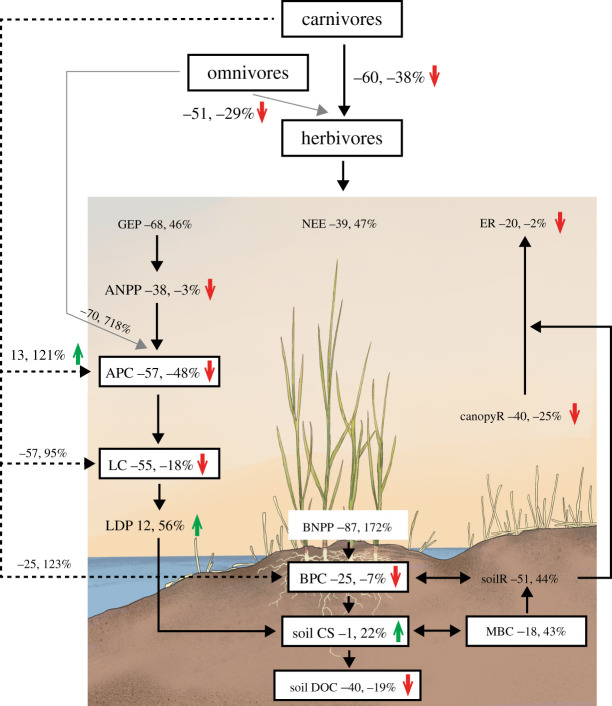
Figure 2.
Consumer control of the carbon cycle in coastal wetland ecosystems. Shown are 95% confidence intervals of percentage changes (back-transformed from lnRR estimates). Significant effects are indicated with a green, upward or red, downward arrow (p < 0.06), and effects without an arrow are insignificant. Upward and downward arrows indicate positive and negative effects of consumers, respectively. Carbon cycle measures with a small sample size (less than 10) are indicated with smaller fonts and represent areas that merit future tests. Abbreviations follow figure 1. (Online version in colour.)

