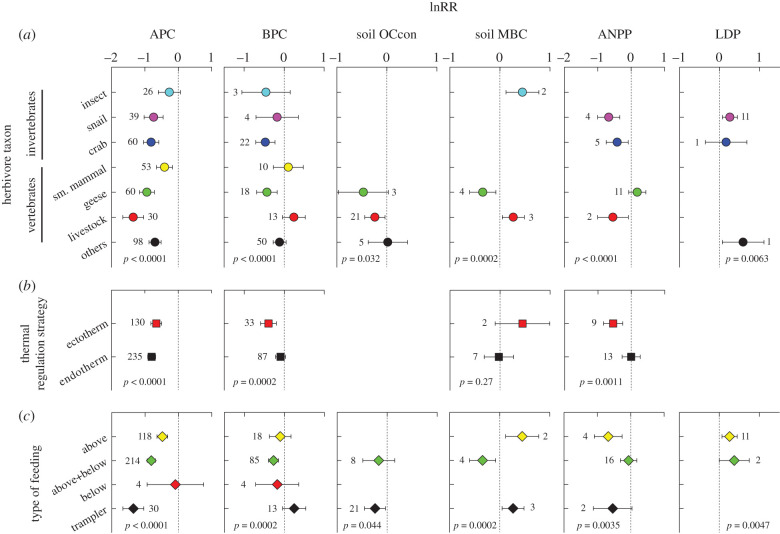
Figure 3.
Herbivore traits and top-down control of the carbon cycle in coastal wetlands. (a) Herbivore taxon (except other herbivores, arranged by body size from the smallest (insects) to the largest (livestock)); (b) thermal regulation strategy; and (c) type of feeding (aboveground herbivores, above- plus belowground herbivores, belowground herbivores, and herbivores with strong trampling effects). Shown are mean lnRR effect sizes (and 95% confidence intervals, estimated with mixed-effects models) of six carbon cycle measures: APC, BPC, soil OCcon, soil MBC, ANPP and LDP. In (a), ‘others’ included herbivores of taxa with few data available and those of multiple mixed taxa. Effect sizes are significant when their 95% confidence intervals do not cross zero. p-values indicate the significance of a trait in mediating variation in lnRR. Abbreviations follow figure 1. (Online version in colour.)

