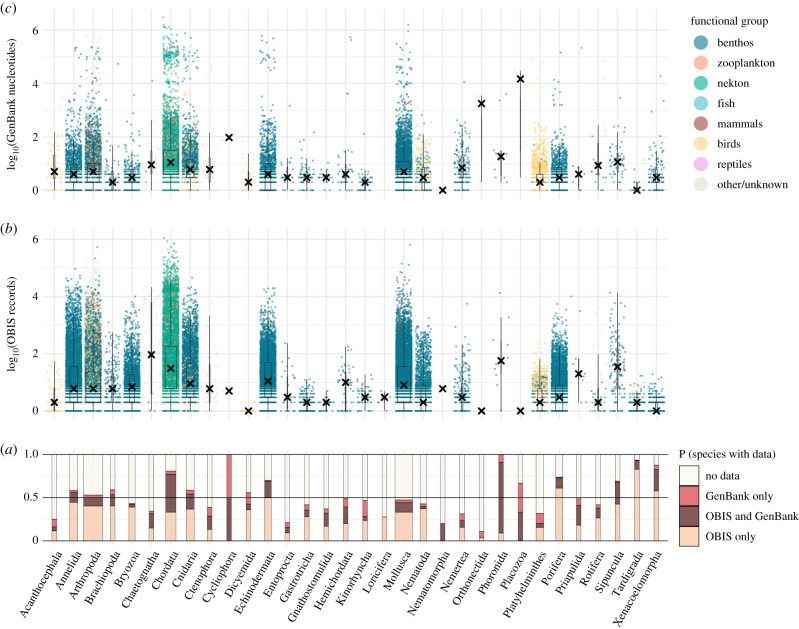
Figure 1.
Availability of biogeographic (over 45 M OBIS occurrence records) and genetic (over 56 M GenBank nucleotides) data across 206 849 marine animal species, summarized by phylum and by broad functional group. (a) Proportion of species in each phylum with data in either database, both databases, or neither. Bar width is proportional to the number of species in each phylum. The number of (b) OBIS occurrence records and (c) GenBank nucleotide sequences are shown for species that occur in the respective database. Each point represents a species, coloured by functional group. Box plots are superimposed with X marking the median number of records within each phylum. Phylum size varies from two species (Cycliophora) to 57 336 species (Arthropoda).

