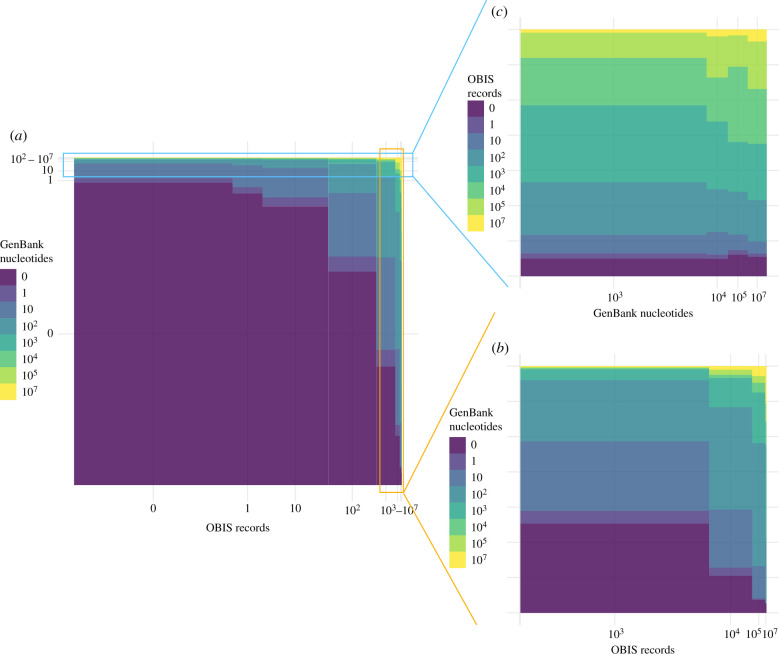
Figure 3.
Mosaic plot showing the joint distribution of species between categories of OBIS records and GenBank nucleotides. Panel (a) shows all species, and is dominated by species with no records in either database, (b) zooms in on species with high numbers (greater than 100) of OBIS records and (c) reverses the axes and zooms in on species with high numbers (greater than 100) of GenBank nucleotides. Axis labels indicate the number of records at the right-hand bound of each category.

