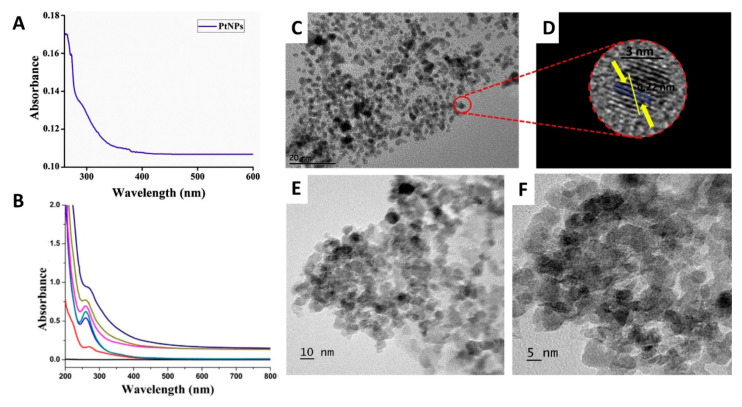
Figure 2.
Characterization of PtNPs phytosynthesized utilizing plant extracts using UV/Vis spectrophotometry and TEM. (A,B) are the UV/Vis spectra of the biosynthesized PtNPs using Nigella sativa and Mentha piperita, respectively. (C,D) are the TEM and the HR-TEM images of the biosynthesized PtNPs using Nigella sativa. (E,F) are the TEM images of the biosynthesized PtNPs using Mentha piperita at a scale of 10 and 5 nm, respectively [62,76].

